Friends of mine often joke with me when I go on vacation because something significant always happens in the markets. Last week while on holidays was no exception:
Gold made it's August bottom last week and probably the bottom of it's recent 4 month correction, as long as typical month end weakness does not take it lower;
The bond market broke with longer term yields making new highs;
Canadian Banks stocks broke down to new lows;
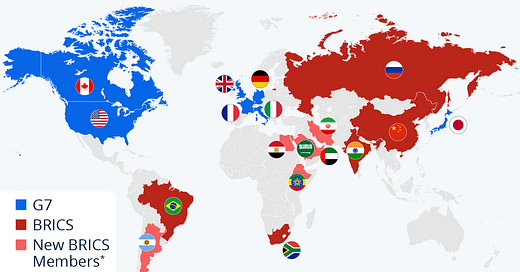
It is the end of the 'petrodollar' last week, at the BRICS summit six new countries were invited to join including oil giants Saudi Arabia and United Arab Emirates;
Earthstone Energy gets surprise buyout offer.
The Biden administration made a huge mistake by implementing sanctions on a major world power, Russia. The sanctions had no affect and probably hurt the U.S. and Europe more than Russia. Using the dollar as a weapon exposed the U.S for who they are and really incensed countries to move away from and sell dollar based assets. It was the perfect fuel to ignite expansion of BRICS.
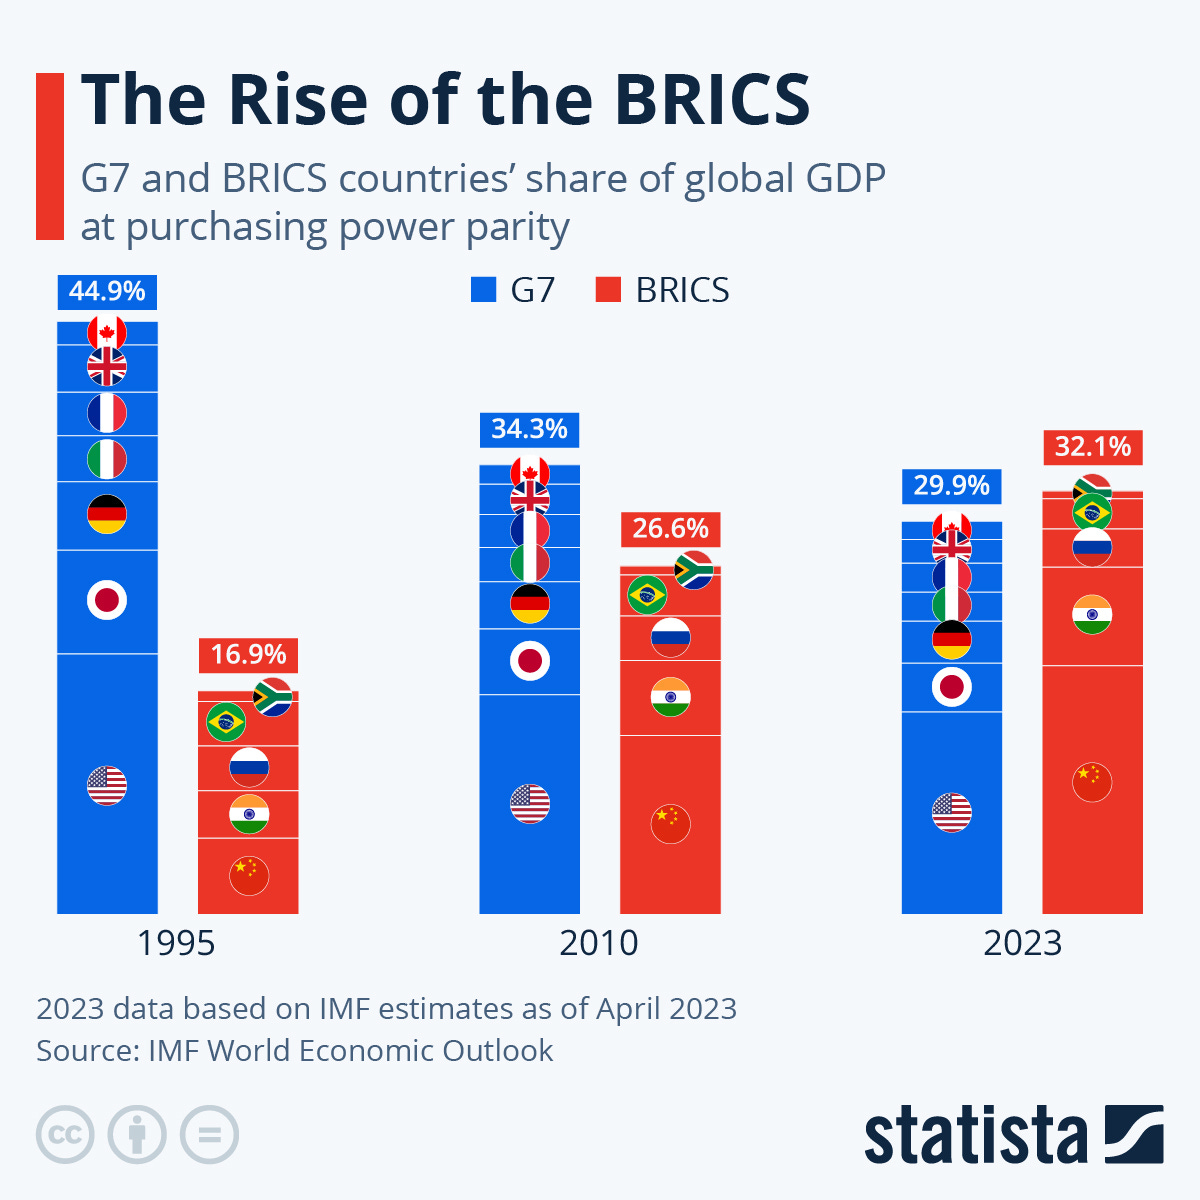
Iran is also joining BRICS and although it is only the 10th largest exporter of oil, it holds about 1/4 of middle east oil reserves. BRICS just got going in 2009 and got it's official name in 2010. It has already become bigger in GDP output than the G7 in less than 13 years. And the recent additions, which are a first since 2010 will about double the size of BRICS. There is no doubt that BRICS will be the dominate force in the world going forward. BRICS have now pretty much surrounded the Persian Gulf. With the addition of Egypt and Saudi Arabia they now basically control the Red Sea and the Suez Canal. And in general these are not our allies.
It s only a matter of time when most of oil trading will be done without using US$. This spells the end of the 'petrodollar' that was a major factor make the US$ a reserve currency. It will take more time before BRICS announces their own trading currency, but it is probably coming within the next year. This all means quite a devaluation in the US$ compared to gold and will be a major factor, along with inflation driving the next bull leg up in gold.
And speaking of gold, have we made a summer bottom?
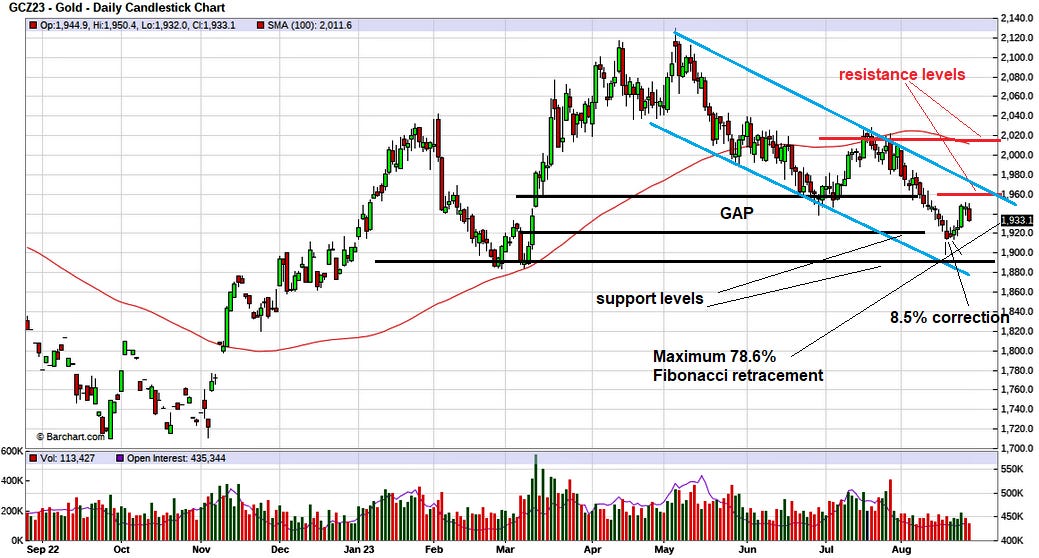
Most often we have summer rallies in gold or a summer bottom and this year it qualifies as a bottom. However, is this the final bottom before the next bull leg? The chart that follows is quite busy so the blue lines mark the current down trend channel and red lines resistance. Important is the gap up going back to March. Stocks and futures often fill gaps formed previously, whether up or down, so August trading has filled that March gap. This could be a signal of a bottom, plus we have had the full Fibonacci retracement from the previous up move of March to May. The summer doldrums also provide the fundamental timing of a bottom. So far the correction has been 8.5% so it is significant but not that bad or unusual. The catalyst that can move gold up is continued central bank buying and the expansion of BRICs moving away from the US$. I can see this, but when will the market catch on? I will be watching closely.
The other thing that can be bullish for gold is turmoil in the markets because gold is often viewed as a hedge to market uncertainty and we are moving more so to that uncertainty. The bond market is much larger than stock markets and bearish move in bonds can have dramatic effects.
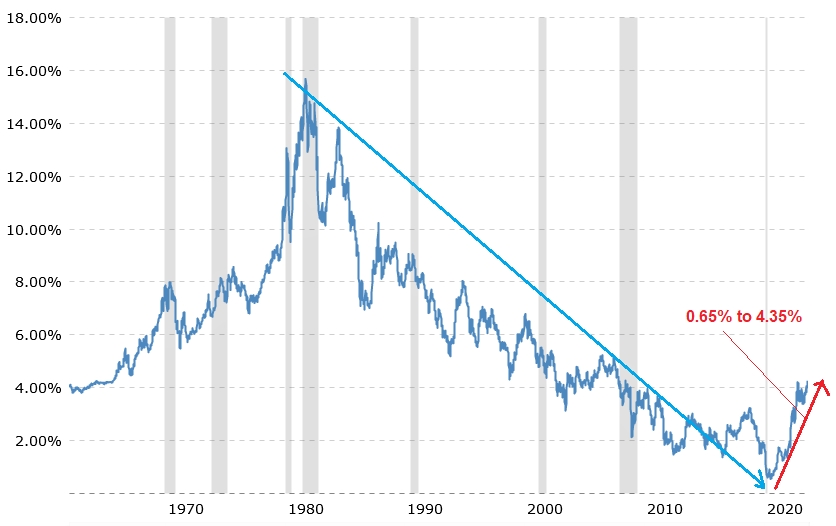
This next chart is the yield (interest rate) of the 10 year treasury bond. Bond prices move in the opposite direction so when yields are rising, bond prices are going down and bond investors are loosing money.
We did have the biggest and longest bond bull market in history from 1980 to 2020. These days are over and seldom you see such big up moves with interest rates. In 2021 rates rose from about 1.0% to 1.76% and then in 2022, rates rose from 1.76% to 3.55%, so about a 100% increase. To put this in a better investment perspective, the 10 year treasury bond started the year 2023 around $104 and the recent low was around $94 which equates to about -10% loss.
We have not witnessed such a big up move in bond yields for over 40 years. You have to go back to the 1970s to compare. I have been commenting for the last couple years that we are heading into a period of stagflation like the 1970s and my prediction is being proven more so as time goes on. Soon we will have the stagnant growth and recession.
This trend strongly suggests that US Treasury bond yields, widely regarded as the risk-free yardstick against which all other credit is measured are going significantly higher, not stabilising close to current levels before going lower that has been the narrative. Treasury bond yields could easily double, and the Fed and government will be powerless to stop them going higher (can you say 1970s again). The implications for interest rates globally are that they will be forced considerably higher as well. Bond markets around the world show the same conditions.
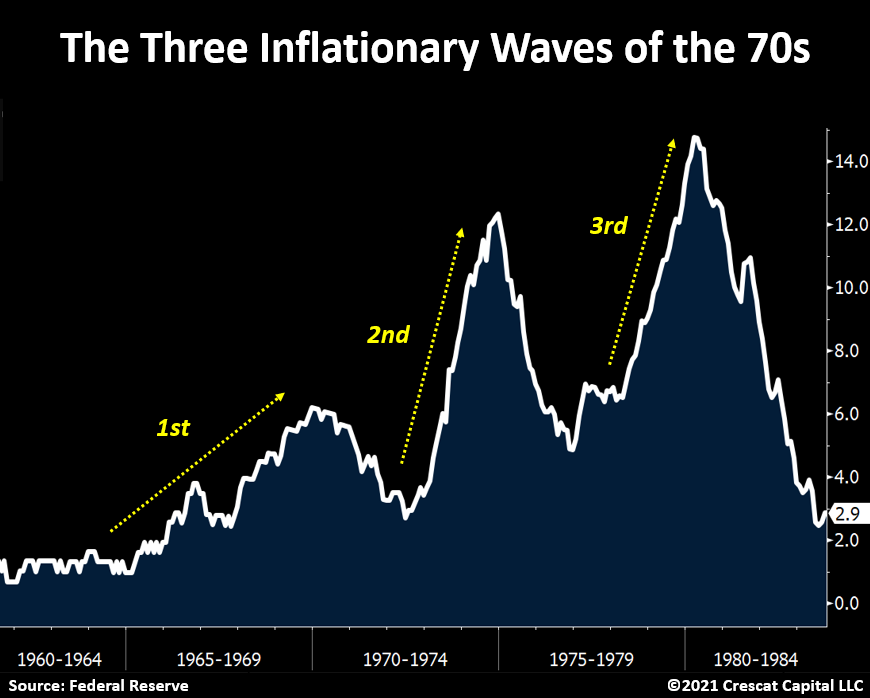
A colleague of mine sent me this 1970s inflation chart with a look see where we are likely headed.
We're entering the 2nd phase where the commodities (and gold) go up and wages keep going up...and inflation either goes up or is persistently too high for the Fed. Inflation is very psychological, and has taken hold. When you go anywhere - the first thing you notice is price. When labour negotiations come up - you want what the other guy is getting - and more – because inflation. WAGE SPIRAL: The Average US Worker Wants $80k. Just like the 1970s, strike action by employees is on the rise, next could be the Auto workers. United Auto Workers union, has approval from workers at Ford, General Motors and Stellantis to strike if a new contract is not worked out before Sept. 14th. A wage price spiral has begun. The Fed acted way too late and never had a chance with all the Covid stimulus.
Inflation and interest rate fears are probably the reason that many Canadian banks stocks hit new lows last week. The market is getting edgy about future loan and mortgage losses for the banks. Bank earnings have been falling because of loan loss provisions. For example, TD bank has set aside over $2 billion for loan losses in the first 9 months of their fiscal year and Scotia Bank over $1.3 billion for the first six months of their fiscal year. Scotia Bank will report Q3 tomorrow, August 29th. Last week, I heard an analyst on Bloomberg who summed up Canada real estate well. I have commented that the Canadian housing bubble is much bigger than the US one in 2007 and this analyst highlights that it is the biggest real estate bubble ever and in all of the world. What makes it potentially worse he notes, that is at the same time as a Canadian credit bubble. This is going to end badly with a real estate crash, only the timing is not certain, but it won't be long with bonds and mortgage rates increasing further. The banks are using gimmicks to postpone the blood bath while at the same time setting asides $billions for the losses they know are coming. The banks are protecting their ass, while using yours!!!!!
I warned on the China real estate bubble about 2 years ago, Evergrande would go under and it continues to unwind. So be it as China Evergrande, just filed for protection under Chapter 15 of the U.S. bankruptcy code, which shields non-U.S. companies that are undergoing restructuring from creditors. Evergrande already slipped into a liquidity crisis in 2021 following government efforts to curb speculation in the sector, and currently has around $300B in liabilities. China's bubble was not on prices but it was over building, using house construction to bolster the economy while the houses remained empty.
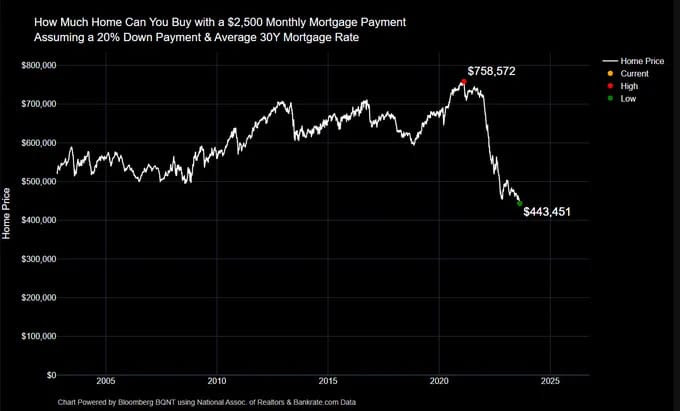
Both Canada and the US have housing affordability issues, but the US has a huge advantage with locked in 30 year mortgages while Canada is mostly 5 year and they will be our death kneel. US housing affordability is sitting at four-decade lows. According to Freddie Mac, the average rate on a 30-year fixed mortgage jumped to 7.09% recently. That's the highest in over 21 years. Three years ago, a $2,500 monthly mortgage combined with a 20% downpayment could get you a $758k home. Today, the same monthly payment and 20% down are only enough for a $443k home (shown in the nice chart below).
U.S. retail sales grew stronger than expected in July in yet another sign of robust consumer spending. Total retail and food services sales - including spending at stores, online and in restaurants - amounted to $696.4 billion in July, up 0.7 percent from June and 3.2 percent from July 2022. While retail sales have been surprisingly resilient throughout the inflation crisis, it's important to note that consumer prices also grew by 3.2 percent in July, meaning that virtually all of the year-over-year increase is attributable to higher prices.
Many analysts and the Fed have been surprised with the strength of the consumer and once again, go back to the 1970s. Back then consumers spent and borrowed as fast as they could, because waiting to buy only meant you would pay higher prices.
The bond bear market has been very tough on mutual funds. Funds typically invest with the 60 to 40 split (60% bonds and 40% equities), so a bond bear market can be more of a problem for them. They have saw record redemption in Canada. Newly-released stats from the Investment Funds Institute of Canada (IFIC) reveal that mutual fund net redemption in May 2022 totalled $6.4 billion, escalating the investor pull-back in April which saw net redemption of $4.9 billion. The new record for monthly redemption was led by balanced funds (net redemption of $5.3bn), equity funds ($994m), and bonds ($882m).
Global mutual funds are showing the strain from stressed markets as redemption suspensions hit a 10-year high, according to Fitch Ratings.
In a new report, the rating agency said that US$62 billion worth of mutual funds have suspended redemptions so far this year. This is already double the volume recorded last year, and marks the highest level in the past 10 years. In particular, the report noted that regulators have identified property, high-yield bond and emerging market debt funds as most exposed to liquidity risk.
In Canada, in response to liquidity concerns, securities regulators temporarily doubled the short-term borrowing limit for mutual funds from 5% of net asset value to 10%. Fund selling is hitting many stocks and can be quite negative on small stocks like Zonte.
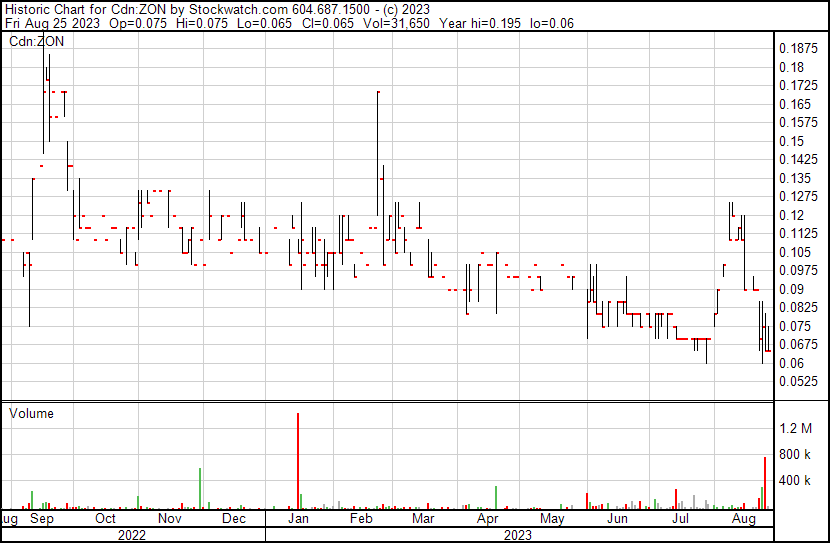
Zonte Metals - - - - - TSXV:ZON - - - - - - Recent Price - $0.065
Entry Price - $0.12 - - - - - - - - Opinion – buy, average down
The funds were back selling Zonte last week with Anonymous selling about 1.2 million shares, forcing the stock lower. I would just sit with bids at 5 or 6 cents until we have some good evidence that funds are done selling.
Earthstone - - - - - NY:ESTE - - - - - - Recent Price - $19.40
Entry Price - $13.34 - - - - - - - - - Opinion – hold, take Permian stock
Surprise news with a buyout of Earthstone last week by Permian Resources Corp. (NYSE: PR). The companies entered into a definitive agreement under which Permian Resources will acquire Earthstone in an all-stock transaction valued at approximately $4.5 billion, inclusive of Earthstone’s net debt. Under the terms of the transaction, each share of Earthstone common stock will be exchanged for a fixed ratio of 1.446 shares of Permian Resources common stock. The transaction strengthens Permian Resources’ position as a leading Delaware Basin independent E&P with over 400,000 Permian net acres, pro forma production of approximately 300,000 Boe/d1 and an enhanced free cash flow profile to increase returns to shareholders.
Key Highlights from the news release:
Enhances leading position in the Delaware Basin and increases operating size and scale
Adds significant high-quality inventory offset the Company’s existing core acreage in New Mexico
Highly accretive to key financial metrics before synergies, including operating cash flow, free cash flow and net asset value per share
Expected to be accretive to free cash flow per share by an average of >30% per year during the next two years and >25% per year during the next five and ten years
Expect to achieve synergies that will drive ~$175 million of annual cash flow improvement
Improved free cash flow profile supports 20% increase to base dividend per share and higher future variable shareholder returns
Meets and exceeds all of Permian Resources’ rigorous investment criteria
Maintains strong balance sheet with expected leverage2 of less than 1.0x at closing
Represents an 8% premium to the exchange ratio based on the 20-day volume weighted average share prices
I believe ESTE was sold too low but the whole sector is cheap. Permian got a good deal but if we just take Permian stock, we will benefit too. This will result in a larger undervalued oil & gas company with benefits including scale, synergy, delivery savings, large G&A savings, finance saving and much more.
This merger will definitely create a bigger company and attract large investment institutions like mutual funds and other asset managements rather than small hedge funds today. I think the buyout is undervalued but so is the combined entity so we should be able to ride Permian to higher prices. They are currently running 11 operated drilling rigs that will mean steady production growth and all funded by operating cash flow. They will have large expansion room in the Delaware Basin, which has some of the best well economics in the U.S.
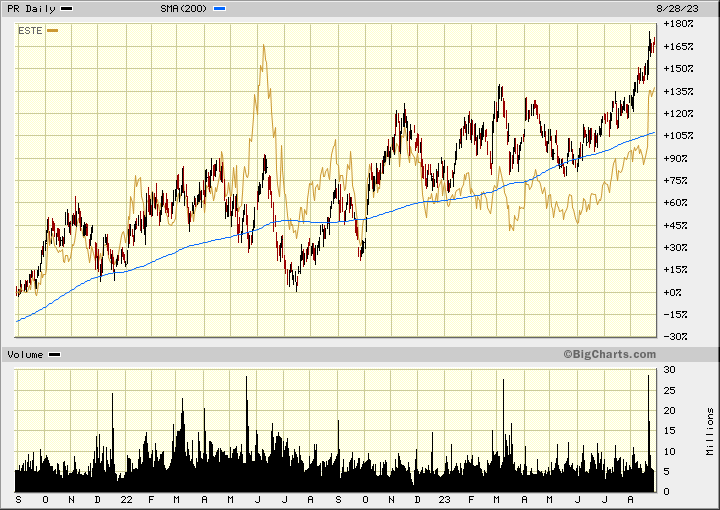
The other point I will make that is very interesting and that is Permian's stock chart. It has been performing better than ESTE and with this acquisition, I expect that upward trend will continue. In the past 2 years, ESTE was up about 100% before the buyout and PR is up about 170%.
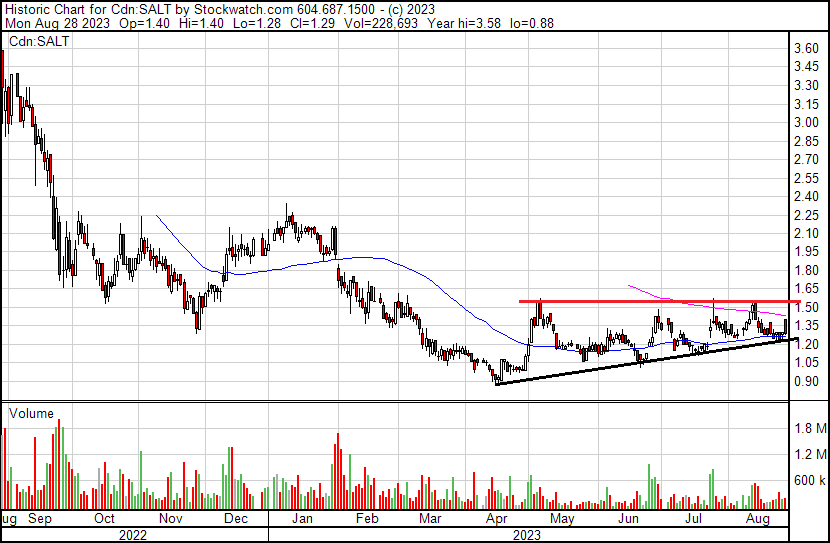
Atlas Salt - - - - - TSXV:SALT - - - - - - - Recent Price - $1.30
Entry Price - $0.80 - - - - Opinion – buy on weakness, < $1.20 and breakout > $1.60
SALT released the results of a feasibility study (FS) and updated mineral resource estimate prepared by SLR Consulting (Canada) Ltd. on its Great Atlantic salt project. The FS represents a significant economic improvement over the preliminary economic assessment (PEA), also completed by SLR, released by Atlas Jan. 30, 2023 (all figures in Canadian dollars).
In addition, SLR has also provided an expansion case to 4.0 million tonnes per year (Mtpa) of road deicing salt over a 47.5-year mine life presented at a Preliminary Economic Assessment (PEA) level analysis. This demonstrates a robust upside production scenario with a pre-tax net present value (NPV) at 8% of $2.015 billion (CDN) and a pre-tax IRR of 28%. The expansion case is based on Probable Mineral and Inferred Mineral Resources. Inferred are quite speculative, so you should take the expansion with a grain of salt (pun intended). There is no certainty that the production forecasts on which the expansion case is based will be realized.
Robust economics based on 2.5 million tonnes-per-year production over a 34-year mine life:
Pre-Tax Economics:
Internal Rate of Return (IRR) of 23%;
Net Present Value (NPV) at 8% of $1.017 billion;
Payback in 4.2 years after commencement of operations;
Low-cost production - utilizing a Q3 2023 cost basis of $22.70 per tonne FOB originating port.
Expansion of Indicated Mineral Resources, and first-time declaration of Mineral Reserves:
Updated Mineral Resource Estimate:
Indicated Mineral Resources totaling 383 Mt at 96.0 % NaCl;
Inferred Mineral Resources totaling 868 Mt at 95.2 % NaCl;
Probable Mineral Reserves totaling 88.1 Mt at 96% NaCl.
Good news was expected here and we might see the sell on news effect. The pattern on the chart I talked about before is still intact. There is a trend of higher lows, but we need to see a clear break above $1.60 for a stronger up trend.
Warning, I saw this from Jim Richards and provide the Post link
“Users become hooked quickly and download the Temu app directly, so they don’t have to wait for pop-up adds on other apps. In less than 10 months, over 50 million Americans have downloaded the app on Google Play. Temu is also the number one app on the Apple Store. It is taking American consumers by storm. There’s only one problem. Temu is illegally installing malware on your phone or laptop that ransacks and downloads your personal data. There is also embedded coding that makes it almost impossible to delete Temu once it has infected your device. All of this data is immediately handed over to the Chinese Communist Party where it is used to spy directly and compile personal dossiers on Americans for purposes of future spying.” Check this article on NY Post
And one last note because I just saw this news. Trump's trial date is set for March 4th 2024. Is it just a coincidence that it is a day before the most important candidate election in the Republican race, known as super Tuesday on March 5th 2024? That’s when the largest number of delegates, which candidates win state-by-state, are up for grabs of any single day in the primary cycle.
I am no Trumper and he has no shortage of faults but this is becoming more clear all the time that this whole fiasco is election interference. For what ever reason, the Democrats and establishment are scared out of their wits with this guy.
All forecasts and recommendations are based on opinion. Markets change direction with consensus beliefs, which may change at any time and without notice. The author/publisher of this publication has taken every precaution to provide the most accurate information possible. The information & data were obtained from sources believed to be reliable, but because the information & data source are beyond the author's control, no representation or guarantee is made that it is complete or accurate. The reader accepts information on the condition that errors or omissions shall not be made the basis for any claim, demand or cause for action. Because of the ever-changing nature of information & statistics the author/publisher strongly encourages the reader to communicate directly with the company and/or with their personal investment adviser to obtain up to date information. Past results are not necessarily indicative of future results. Any statements non-factual in nature constitute only current opinions, which are subject to change. The author/publisher may or may not have a position in the securities and/or options relating thereto, & may make purchases and/or sales of these securities relating thereto from time to time in the open market or otherwise. Neither the information, nor opinions expressed, shall be construed as a solicitation to buy or sell any stock, futures or options contract mentioned herein. The author/publisher of this letter is not a qualified financial adviser & is not acting as such in this publication

