Unprecedented Times so Brace Yourself
At 68 and all grey hair, I have witnessed and learned many many things. I read on average about 6 hours per day. In all my years I have never saw such a mess in the economy, government and our very culture. There is actually 3 revolutions underway at this time, a political government one, economic and culture. It is no wonder most people are confused, in disbelief and/or trying to run and hide. I am doing an in depth look at these revolutions in another newsletter issue. But for today, I have a shorter update.
Early in the year I was warning about a plunge in the bond market. I also did a Seeking Alpha article in January called 'Something Could Break in 2023' and my conclusion that it would be the bond market. Most everyone who commented thought I was just too negative. In fact some of my articles on other platforms have been rejected because of this. My late father use to say, 'if the truth hurts, let it hurt'. And for many, boy is it hurting.
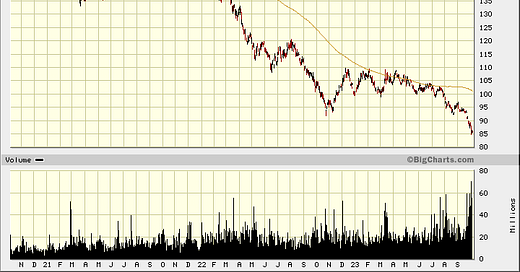
The only way to really describe the long bond market is simply it has crashed. The 10 year treasury is down over -40% since 2021 and the 30 year bond is down -65%. This is a chart of the iShares 20 year Treasury Bond ETF 'TLT”. It broke down in September and is now down about -50% from 2021.
The majority of analysts did not see this coming. They are simply to green and have zero experience in this type of market. This has not happened in over 42 years. You, you have to go back to 1970s when most of the current analysts were in diapers or not born yet. I have been warning about sticky inflation and Stagflation for about 2 years. Well folks, it is upon us. It is just that most of Wall Street does not know it yet, but a few more are catching on recently.
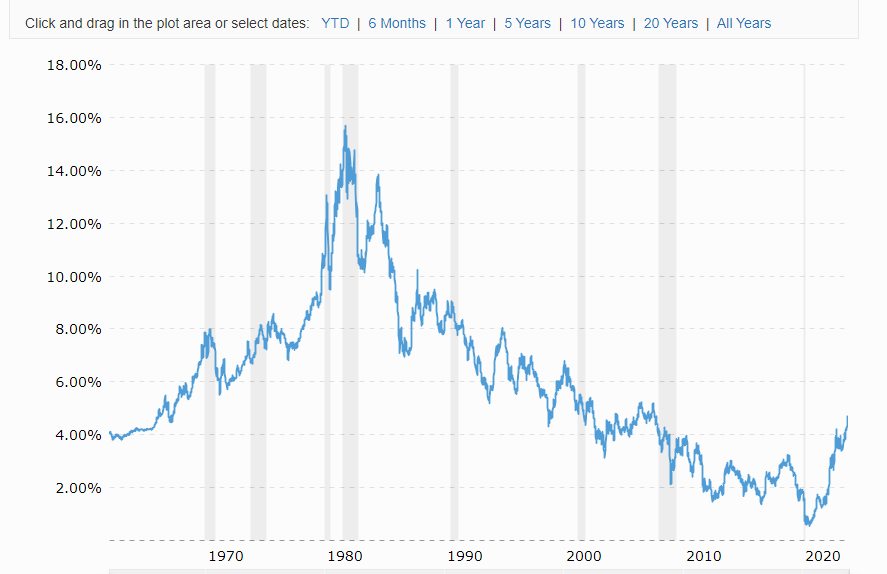
This is a chart of the 10 year treasury bond going back to 1962. It shows yields or interest rates. Bond prices go down as rates increase. You can easily see that rates have not had a significant move like the last 2 years since the 1970s. What makes it worse is now we have come up from such a low level. For example in late 1977, rates moved up from 7.5% to 12.7% in February 1980. About a 5% increase or a 66% move up. In July 2021, rates were around 1.3%. and have now jumped to around 4.5%. That is 3.2% rate increase and up about +240% from 2021. The increase is a much bigger shock. "The magnitude of the bond selloff has been so stunning that stocks are arguably more expensive than a month ago," said Barclays.
Gold will have it's day and it will be big
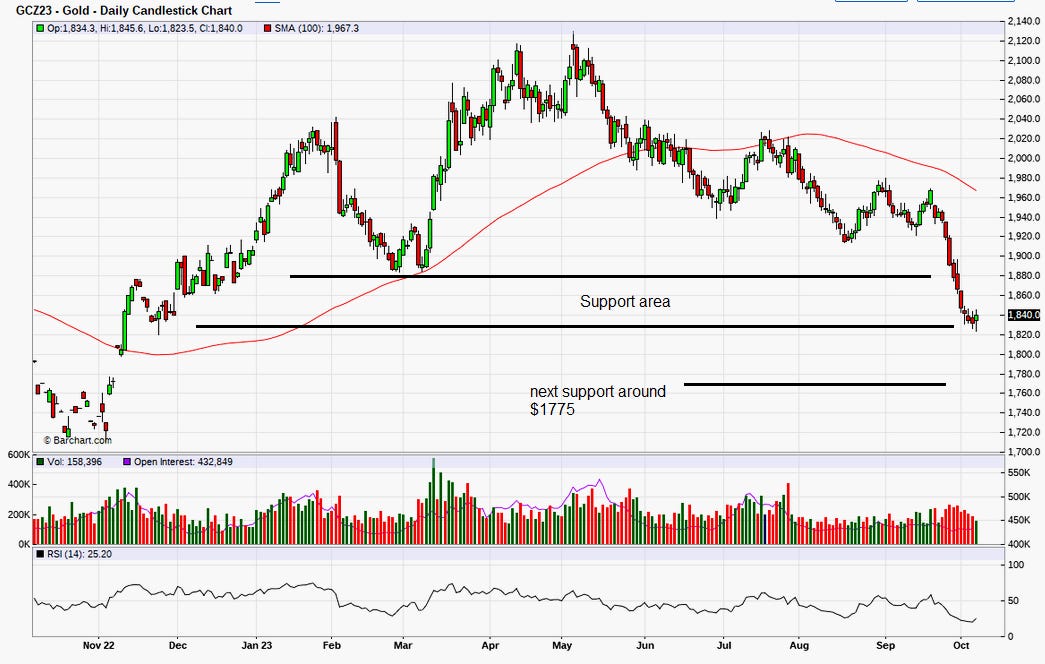
If gold went down again Friday, it would be down for 10 days in a row. I can never remember seeing this before. In fact I went back through my charts to 2017 and could find a few instances whwere it went down 7 or 8 days in a row, but not 9 after Friday’s reversal. Short term it is very, very over sold and I believe there should soon be at least a relief rally. Gold is higher Monday with the conflict in Israel, but I believe it would have increased anyway from such an over sold condition
Gold will do very well in this higher inflation and stagflation scenario. However the market with all these green analysts has not figured this out yet. Their thinking is that with higher interest rates it makes gold less attractive, but look what is happening with stocks and bonds. With the recent plunge in gold, the London fix price is about flat on the year, bonds are way down, the Toronto stock index is down -2% but the S&P 500 is still up about 10% on the year. However, that will not last because simply put, stocks will have to go lower to compete with higher yields on bonds. This takes some time to occur, remember just a month ago most analysts were expecting that rates were topping out and would come down in 2024. Now the narrative is “higher for longer”. Their next shock will be when they realize it will be higher forever.
This chart is the December Comex gold on Friday and it was up about +$12 so we did not get 10 down days in a row, but even so, 9 is unprecedented. That said, Friday afternoons can often give wild swings in the markets. Gold has come right down to the very bottom of the support area I had previously outlined. It looks like it is eking out a bottom here and I think this will hold for at least the short term. Next support is around the $1175 area and now $1920 is resistance on the upside. Early Monday, gold is up about another +$12.
Surprise, surprise, surprise as Gomer Pyle would put it
The jobs report was a big surprise Friday at a 336K increase, a much stronger number than anticipated, economist had estimated 170K. My last comments were about the monthly numbers always getting revised lower but this time they revised higher. What is surprising is the BLS revised July numbers up +79k from +157K to +236 K and revised August up +40k from +187k to +227K.
I had also commented that the BLS was using the birth/death model to pad to the upside. However with the September number that calculated the birth/death at -119K so the job numbers would have been much stronger without this downward estimate.
All said and done, it just boils down to what I have always called 'The masters of economic data'. They will revise and manipulate to massage the narrative they want to portray. It looks to me they are preparing the market for another 25 point hike at the November 1st meeting.
The market puts too much weight on these numbers. In reality there are labour shortages and a lot of job openings. Wages are rising and will continue to do so that will push inflation higher. There has to be a very severe recession to end this cycle and it eventually will come.
What few realize is that we are already in recession of sorts, but the GDP numbers still show growth but what they are really showing is inflation. The high inflation is driving GDP numbers higher. As I mentioned before the just over 2% GDP rate in the U.S. is lower than the inflation rate. This is how the term 'Stagflation' came about. It means stagnant growth and high inflation. This is exactly what we got, but the market has not figured it out yet. Very few have the experience to recognize it.
What about the GDP Price Deflator?
This number is suppose to compensate the GDP for inflation, but I believe they use a way too low number. For Q2 2023 the Price Deflator was 1.7%. I think it should have been at least 1.5% to 2% higher.
When the market does catch on to this whole stagflation thing, we will do very well with our precious metals and energy holdings. Another thing most of these analysts have wrong is this stagflation scenario also causes a bullish move in commodities, that includes energy. Demand continues strong as consumers and markets have inflated dollars to spend. They chase things because they believe the price will only go higher if they wait. This is another factor that entrenches inflation. The psychology of the consumer changes. And because commodities are hard assets, their dollar price will increase with inflation.
This is what the market currently has wrong. You keep hearing that the higher rates will cause demand destruction. I agree at some point they will but we are not close to this yet. In the late 1970s to 1981, Volcher had to shock the market with a big jump in interest rates. These 25 point hikes the Fed has been taking are baby steps because the central banks fear that is all the markets can handle right now.
Remember there is massive debt everywhere that could implode at any time and banks are not out of crisis yet. According to the FDIC, as of June 30 there were 4,645 federally-insured commercial banks and savings associations in the United States. Uninsured deposits at all 4,645 institutions totalled $7.134 trillion at the end of the second quarter. It was these uninsured deposits that sank the 3 banks that failed earlier this year.
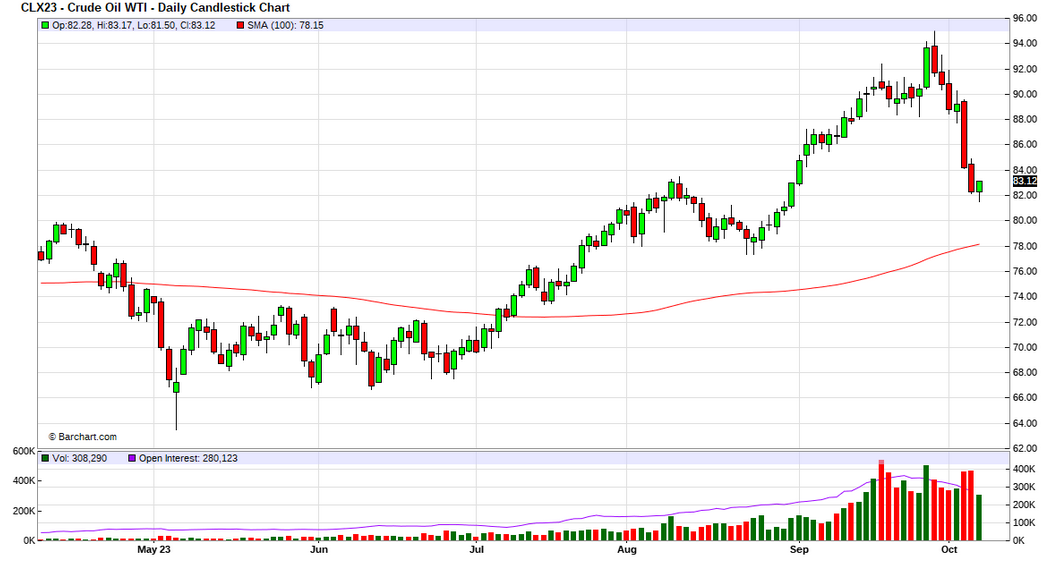
But according to call reports filed by JPMorgan Chase Bank, Bank of America, Wells Fargo, and Citigroup's Citibank, as of June 30, just those four banks accounted for $4.185 trillion of uninsured deposits, or 59% of all uninsured deposits at all 4,645 federally-insured institutions. Are they too big to fail again? A delicate balance with rates has to occur. This demand destruction narrative is all you heard in the past week with oils sell off. This chart is from Friday, so does not show the further increase on Monday.
The real reason that oil sold off is because the investment funds have been taking a blood bath on their bond portfolios so are selling the assets that are still up in price to meet record redemption on their funds. What they have been selling is oil, gold and stocks that are all down significantly in the last couple weeks or so.
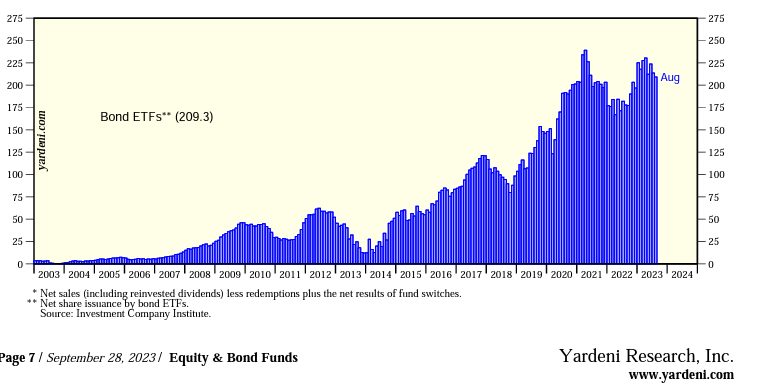
What is really sad is the blood bath investors are taking in bonds. You should never buy bonds in a rising interest rate environment but tons of investors bought the ‘peaking and falling rate’ narrative of the last couple years. Yardeni research does piles of good data compilation and this chart is from their September 28th report on bonds. This chart shows monthly flows into Bond ETFs and it has been on the increase especially in 2020 and 2021. Investors got in at just the wrong time to take a -40% to -65% blood bath. Like the chart of the Bond ETF 'TLT” that I show above, down -50% since 2021.
So if you think you have not done so well with gold and oil you could have jumped into Bonds. I have about 6 to 10 of these bond related stocks and ETFs on my watch list, because I know there will be a time to jump in, but it is not now. These bond investors still have more to lose. The other big factor not talked about much is the premium the market is putting on bonds because the Biden Administration continues to spend wildly. They are still spending at Covid levels, long after it is over. Just looked what happened with their last spending bill that ended up in the ouster of Kevin McCarthy as U.S. House speaker. This marks the first time in history that the House has removed its leader and McCarthy’s nine-month speakership was the shortest since 1876, CNN reports. And it was the Democrats that voted him out with just a handful of Republicans. It appears to me these Democrats would rather see turmoil at the expense of running the country. After all McCarthy went to the Democrats as a non partisan to an agreement of a temporary bill to avoid a government shut down. This issue will come up again in mid November and probably result in a shut down that go around.
I had a few questions on Zonte, and I now strongly feel the bottom is in and a strong buy.
Zonte Metals - - - - - TSXV:ZON - - - - - - - - - Recent Price $0.035
Entry Price - $0.12 - - - - - - - - - Opinion – strong buy to $0.035
I have been reluctant to suggest a strong buy on the stock even with such a low price recently because there has been a fund selling from the last flow through placement. As I have been commenting and again above that investment funds are taking a blood bath in their bond portfolios. They have to liquidate a lot of positions and in this case, Zonte has been one of them for this flow through fund.
From what I can gather, the fund probably has 1 million shares or less left to sell. There has been a friendly bid in this week for 1 million shares at $0.25 so one way or another, these last shares by the fund are going to be cleaned out of the market and the stock will bounce back up. This snap shot is from Friday and Canadian markets are closed Monday for Thanksgiving holiday.
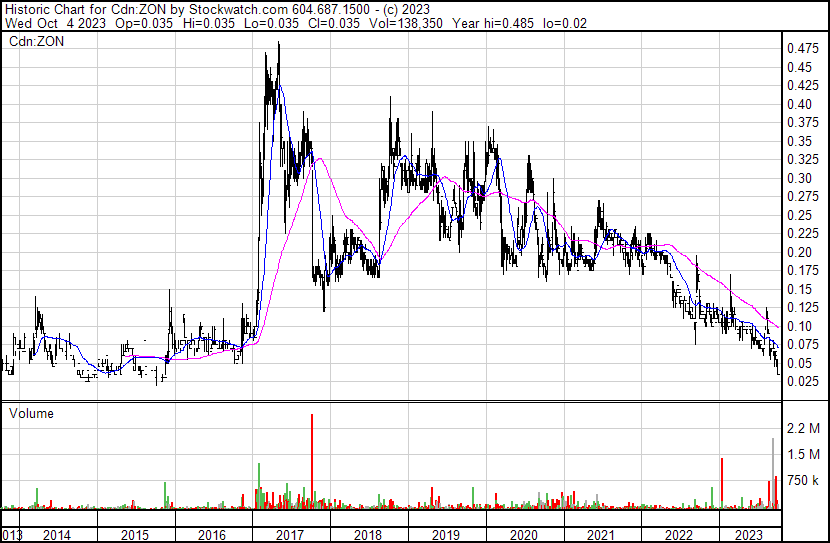
As in this snapshot Friday afternoon there has been a lot of bids for cheap shares. I only have a strong buy to 3.5 cents because I think if there is a lot of bids there, this fund seller will hit them. There is no sense chasing the stock higher until this seller is done, but you might as well get some of this cheap stock. I expect a drill program will be announced any time now. Zonte has just been waiting for that last soil assay samples at K6. They may have them by now or soon will. Last I spoke with Terry he had received assay data for other targets. The stock is the lowest it has ever been at prices last seen in 2015. It simply is not reflecting the value of just Cross Hills on its own.
Greenbriar the bottom is in
Greenbriar - - - - - - TSXV:GRB - - - - - - - Recent Price - $1.00
Entry Price - $1.15 - - - - - - - - - Opinion – buy below $1.00
Finally, Greenbriar has executed a formal settlement agreement with the Puerto Rico Energy Power Authority (PREPA), following many years of litigation in both the commonwealth and United States federal courts, plus litigation in front of the Puerto Rico Energy Bureau (PREB). The agreement is beneficial to both parties and, most importantly, beneficial for the rate payers of Puerto Rico.
From the news release last week, the settlement was filed with PREB at 7:21 p.m. ET on Oct. 3, 2023, for PREB approval. Greenbriar is known as PBJL Energy Corp. (PBJL) in Puerto Rico.
The agreement will then head to the FOMB (Financial Oversight and Management Board) for approval. The perfunctory technical work on interconnection with Luma will happen after PREB and FOMB approval. Luma's work is technical and not political. Highlights of the settlement agreement filed on the public record:
PBJL will withdraw its $951-million (U.S.) claim against PREPA;
PBJL pricing is cheaper than any of the RFP (request for proposal) public tranche contracts;
Pricing including storage is 9.85 U.S. cents per kwh (kilowatt-hour) escalating one-half cent per year, to cap at 11.5 cents per kwh;
The PBJL PPOA (power purchase and operating agreement) previously approved by the PREPA board and PREB in 2020 will serve as the base document;
PBJL will cover the transmission upgrades with a cap;
The project size is 80 MWac (megawatts alternating current) (160 MWdc (megawatts direct current));
PREPA has no obligation for 160 MWac (320 MWdc), although PREPA may elect to take the same at its sole discretion.
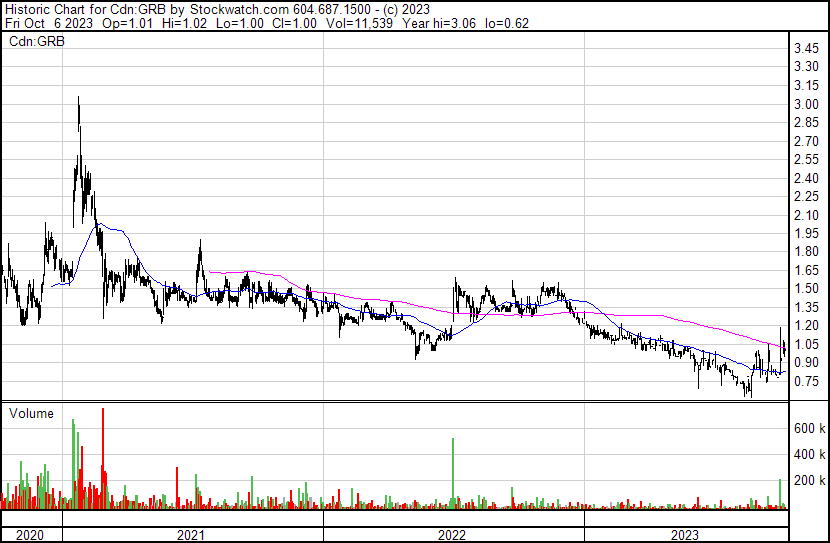
This has been a long time and it should be just a formality with the FOMB, but it is a government agency and we can count on them to work at 1/3 the pace us private sector people do. Remember, Greenbriar has the non dilutive financing to build out the solar project and we will finally see this being constructed in 2024. The stock rebounded on this news and I can confidently say the bottom is now in on this one down in the $0.60s in August.
All forecasts and recommendations are based on opinion. Markets change direction with consensus beliefs, which may change at any time and without notice. The author/publisher of this publication has taken every precaution to provide the most accurate information possible. The information & data were obtained from sources believed to be reliable, but because the information & data source are beyond the author's control, no representation or guarantee is made that it is complete or accurate. The reader accepts information on the condition that errors or omissions shall not be made the basis for any claim, demand or cause for action. Because of the ever-changing nature of information & statistics the author/publisher strongly encourages the reader to communicate directly with the company and/or with their personal investment adviser to obtain up to date information. Past results are not necessarily indicative of future results. Any statements non-factual in nature constitute only current opinions, which are subject to change. The author/publisher may or may not have a position in the securities and/or options relating thereto, & may make purchases and/or sales of these securities relating thereto from time to time in the open market or otherwise. Neither the information, nor opinions expressed, shall be construed as a solicitation to buy or sell any stock, futures or options contract mentioned herein. The author/publisher of this letter is not a qualified financial adviser & is not acting as such in this publication.

