


Chaos Theory, Markets and Bonds, Gold Stock Break Out
US$ Breakdown

Remember this guy, described in Wikipedia, Dr. Ian Malcolm is a fictional character from the Jurassic Park franchise created by Michael Crichton and portrayed by Jeff Goldblum. Malcolm is a gifted mathematician from the University of Texas at Austin who specializes in chaos theory.

His role as Ian Malcolm in Jurassic Park skyrocketed Goldblum's career. Malcolm has become one of Goldblum's most popular characters and has been depicted in many forms of popular culture. The character's signature line, "Life finds a way" .
Wikipedia describes Chaos theory as an interdisciplinary area of scientific study and branch of mathematics. It focuses on underlying patterns and deterministic laws of dynamical systems that are highly sensitive to initial conditions. These were once thought to have completely random states of disorder and irregularities. Chaos theory states that within the apparent randomness of chaotic complex systems, there are underlying patterns, interconnection, constant feedback loops, repetition, self-similarity, fractals and self-organization. The butterfly effect, an underlying principle of chaos, describes how a small change in one state of a deterministic nonlinear system can result in large differences in a later state (meaning there is sensitive dependence on initial conditions). A metaphor for this behaviour is that a butterfly flapping its wings in Brazil can cause or prevent a tornado in Texas.
I think markets could use Dr. Malcom's help now as many think this market is chaos, but there are underlying driving factors. To use Malcolm's line, I would say that over valued, bubble markets find a way to go down. Just as a bear market at some point finds a way to bottom and go back up.
Chaos and Bond Markets Selling Off
The sell off in bond markets has created more chaos for many. When the stock market started to plunge and fears of recessions emerged, money moved into bonds moving prices up and interest rates down. This is the pattern most are used to in the past, but a chaotic thing happened this week, because bond prices suddenly reversed and interest rates are going back up.
I don't think this is a Trump tariff thing because it is happening around the world. This looks like a liquidity crisis, likely caused by one or more banks or large hedge funds in financial trouble. This could have also caused Trump advisors to panic and might be a reason that tariffs were paused in an effort to stabilize markets.
I don't think what ever they do with tariffs will matter. This is a popping stock market bubble and as chaos theory describes - there are underlying patterns, interconnection and constant feedback loops. Check out these bond market charts and I will wind up my theory.
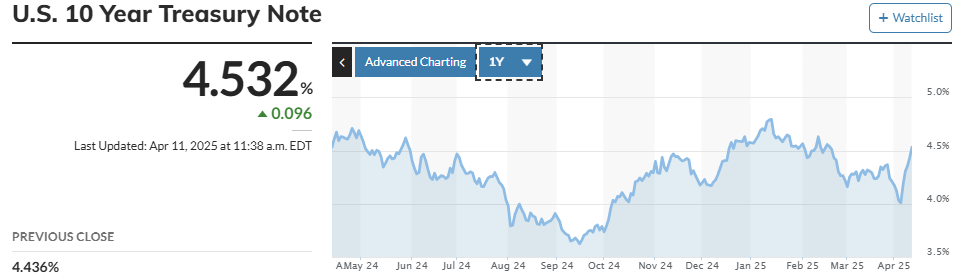
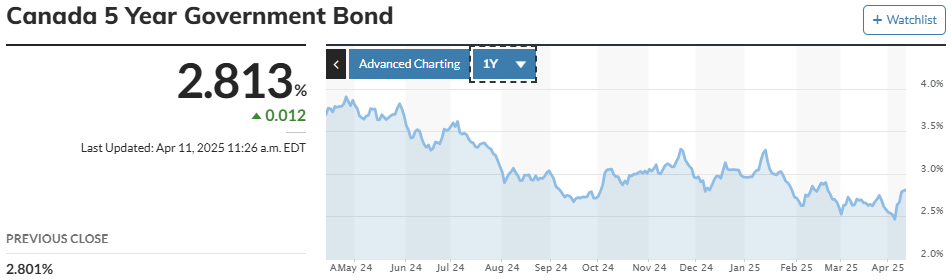
The U.S. 10 year treasury yield shot up to levels back in February before the tariff chaos started and stock markets fell. Canada is the same thing with interest rate levels back to where they were in February.
And you can't blame stubborn inflation for higher interest rates as the last CPI had a surprise drop and today a surprise drop in the PPI. The producer price index for final demand dropped 0.4% last month after an upwardly revised 0.1% gain in February. Economists polled by Reuters had forecast the PPI rising 0.2% after a previously reported unchanged reading in February.
This next chart is the Euro bond market and it had a sharp reversal higher as well. It does not show as dramatic on the chart because I wanted to show a longer term, 3 year chart. My point on that is despite the European countries going into recessions or very slow economies interest rates remain high. This is also more support for my theory that markets have had enough of out of control government spending and are demanding higher rates to fund the debt or just prefer gold.
Euro Bond Chart

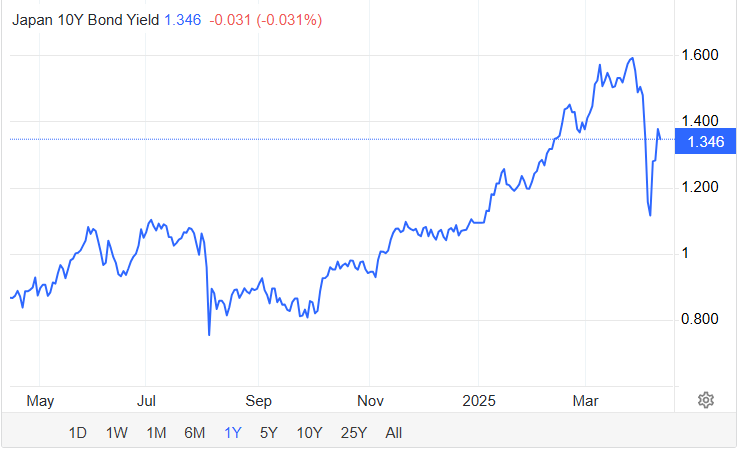
And finally the 10 year Japanese Bond that also was declining nicely and had a sharp reversal higher.
It certainly looks like a liquidity crisis brewing so don't be surprised if we hear about some bank and or fund failures in the coming weeks and months. Often they are able to hold off for some time.
Also think of the typical 60/40 equity/bond mix that many funds use as investment diversification. Their bonds were going up as their stocks dropped, but now their bonds are dropping too. We will keep an eye on how this plays out in the days/weeks ahead. Ideally or best case for markets is to see bonds go back up (interest rates fall).
If it gets bad, we could see the Fed come back with QE. On March 19th the Fed announced they would slow their tightening, as part of the reduction in the pace of quantitative tightening, or QT. The monthly cap of Treasuries that will be allowed to mature and not be replaced will be ratcheted down to $5 billion per month from the prior $25 billion monthly cap, effective on April 1. The mortgage-backed securities cap will hold steady at the current $35 billion limit.
The $5 billion per month is really not much tightening at all.
All in all, the major effect of all this is a continued flight out of fiat currencies to gold, markets have had enough of high deficit spending. Now that U.S. bullion banks and U.S. investment funds have started accumulate gold too, there are more and more hands trying to grab the same pieces of pie.
The pace of the rising gold price is increasing.
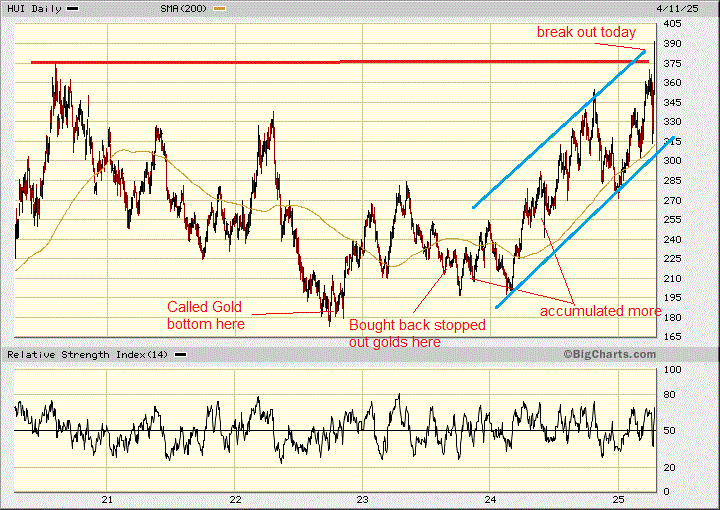
It is all good news for us because we were positioned for this and today gold is up another $75, but most important is the HUI gold bugs index broke to the upside over the 375 number I was waiting for. Finally the HUI 2020 high was breached when gold was only $2,000. I expect most every gold stock is still going to see triple digit gains from today.
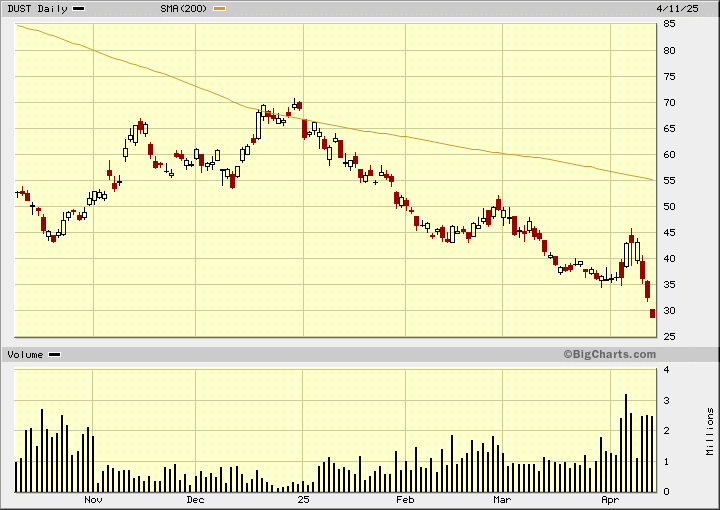
It just amazes me that most of retail is still betting the wrong way with volumes surging into the DUST ETF that is two times short gold stocks. Once retail investors start coming in on the long side, that is when we will see the record highs in silver start to materialize. They will see gold as too high, perhaps north of $4,000 before they wake up, so will buy silver. That's OK, we need them to drive another leg up after the banks and funds.
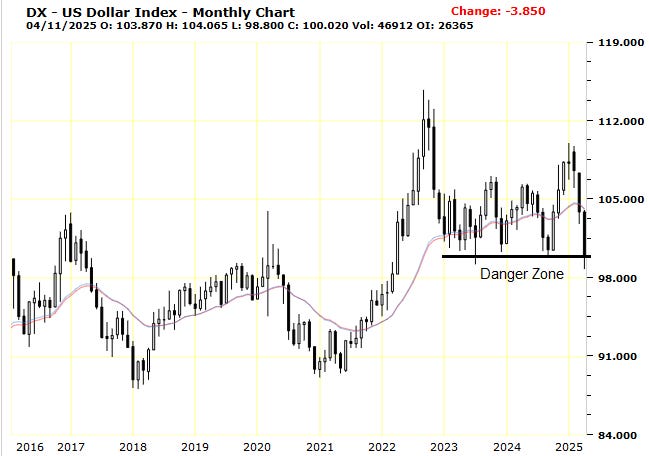
And one last chart of the US$ index. I just showed this last week with my danger zone line, well today the dollar broke down and went into the danger zone. Just another sign of fiat fleeing to gold.
Well I hope everyone has a golden weekend, I know I am

All forecasts and recommendations are based on opinion. Markets change direction with consensus beliefs, which may change at any time and without notice. The author/publisher of this publication has taken every precaution to provide the most accurate information possible. The information & data were obtained from sources believed to be reliable, but because the information & data source are beyond the author's control, no representation or guarantee is made that it is complete or accurate. The reader accepts information on the condition that errors or omissions shall not be made the basis for any claim, demand or cause for action. Because of the ever-changing nature of information & statistics the author/publisher strongly encourages the reader to communicate directly with the company and/or with their personal investment adviser to obtain up to date information. Past results are not necessarily indicative of future results. Any statements non-factual in nature constitute only current opinions, which are subject to change. The author/publisher may or may not have a position in the securities and/or options relating thereto, & may make purchases and/or sales of these securities relating thereto from time to time in the open market or otherwise. Neither the information, nor opinions expressed, shall be construed as a solicitation to buy or sell any stock, futures or options contract mentioned herein. The author/publisher of this letter is not a qualified financial adviser & is not acting as such in this publication.