Where did all the ice go? The short answer is Antarctica.
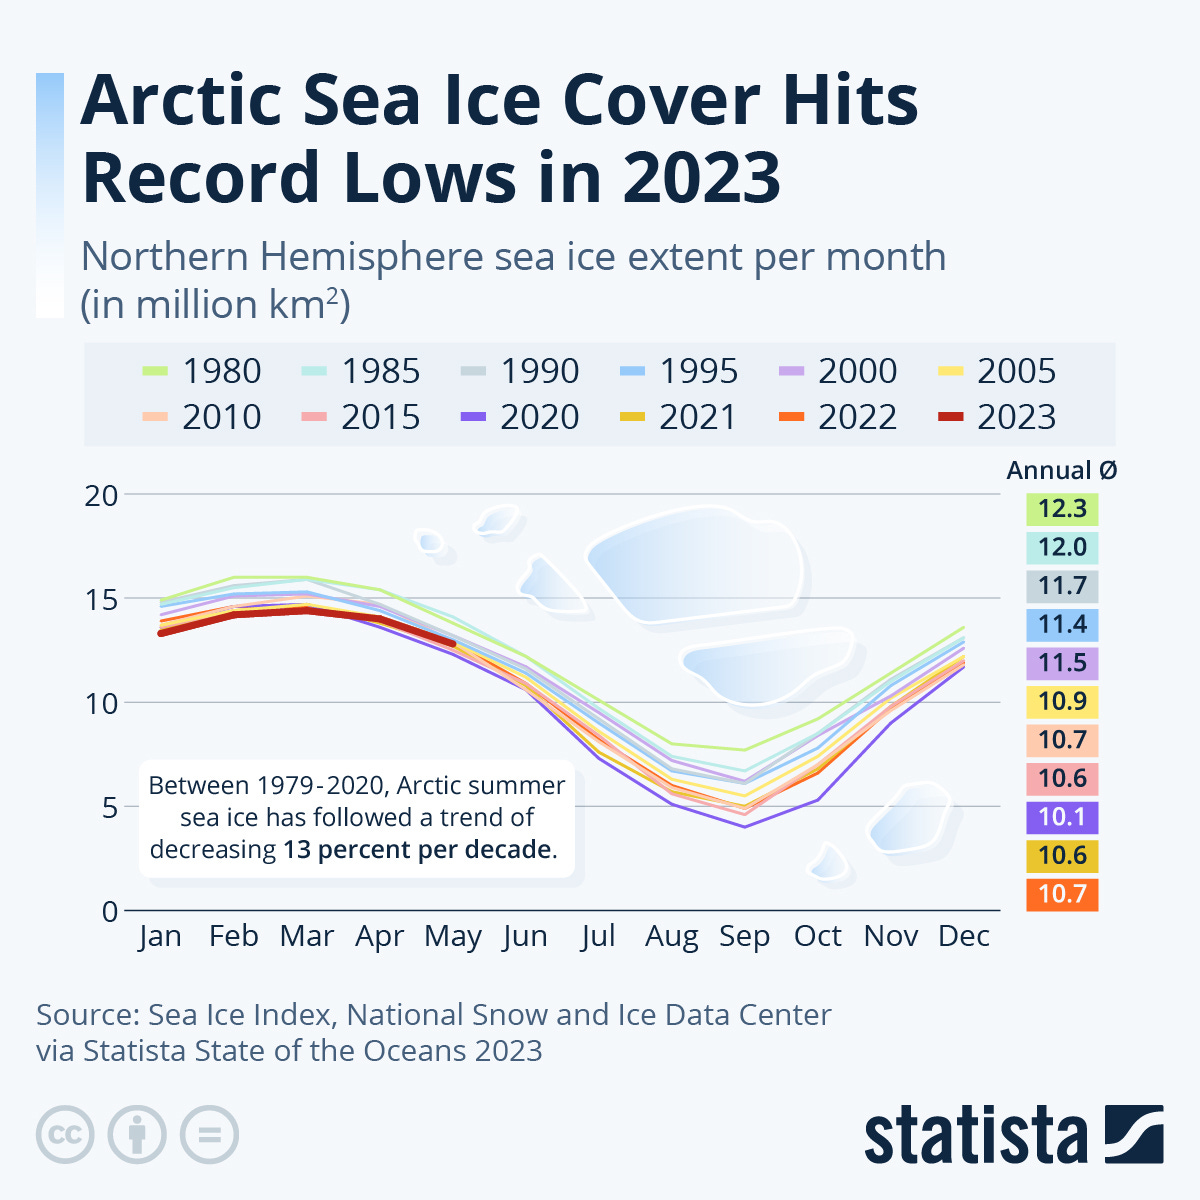
The climate alarmists/scammers will talk about the Artic Ice retreating and it has a little bit. First off it is completely false stating the decline is 13% per decade. The numbers are right there, 12.3 million square km in 1980 and 10.7 in 2022 and yes it is a 13% decline but over more than 4 decades, not per decade. However, over 4 decades would not sound like so much of an alarm.
The sixth assessment report of the IPCC assessed that the Arctic is projected to be on average practically ice-free in September near mid-century under intermediate and high greenhouse gas emissions scenarios, though not under low emissions scenarios, based on simulations from the latest generation Coupled Model Intercomparison Project Phase 6 (CMIP6) models.
However, actual data (not simulations) prove the ice is growing in size in Antarctica.
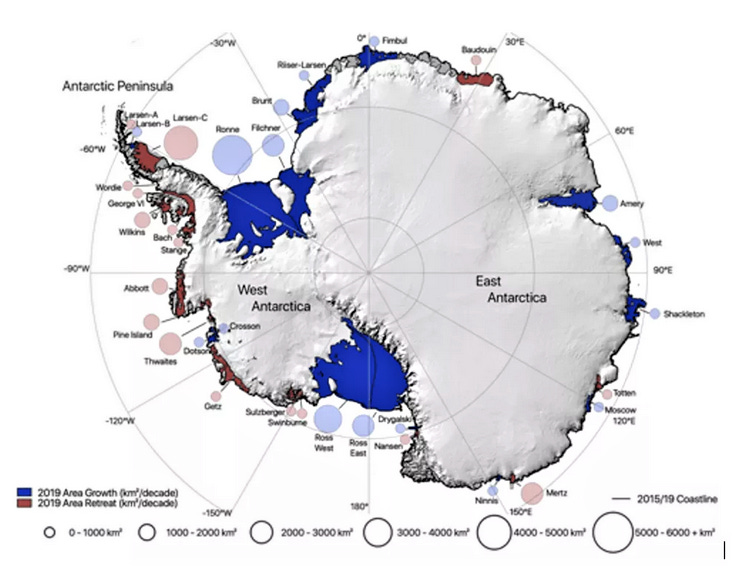
The ice shelves surrounding Antarctica grew in overall size during the 11 years to 2019, according to dramatic new evidence published by three climate scientists from the University of Leeds. The growth was significant with overall shelf area increasing by 5,305 km2, adding 0.4% to the total shelf area in the 11 years under review. The paper has just been published by the influential European Geosciences Union, but it raises questions within the ‘settled’ climate science narrative, so it is highly unlikely to be covered by mainstream media.
They measured the annual calving front position on 34 ice shelves, encompassing 80 % of the Antarctic coastline, over the 11 years from 2009 to 2019. They used over 350 multispectral optical images, acquired by the MODIS instrument on board the NASA Terra and Aqua satellites. Images acquired during the austral summer, from mid-January to the end of February, were selected throughout the decade to ensure consistent sampling and to avoid aliasing seasonal variation in the calving front position.
The Leeds researchers looked at satellite data to measure the annual calving position and area of 34 ice sheets accounting for 80% of the Antarctica coastline. They found reductions in the area on the Antarctica Peninsula and West Antarctica of 6,693 km2 and 5,563 km2 respectively were outweighed by growth in East Antarctica of 3,532 km2 and 14,028 km2 in the large Ross and Ronne-Filchner ice shelves. The largest retreat occurred on the Larsen C shelf when 5,917 km2 was lost in a single calving event that made alarmist headlines around the world. The largest increase, noted in slightly less media detail, was the 5,889 km2 advance on the Ronne platform. Overall, the shelves gained 661 giga tonnes of mass over the decade.
In short, and in less scientific terms, check actual observations, and ignore make-believe computer models, and the resulting stories published by climate alarmists promoting the collectivist Net Zero project.
The major driver of climate change is natural reoccurring cycles. I went into more detail in a piece I wrote back in April.
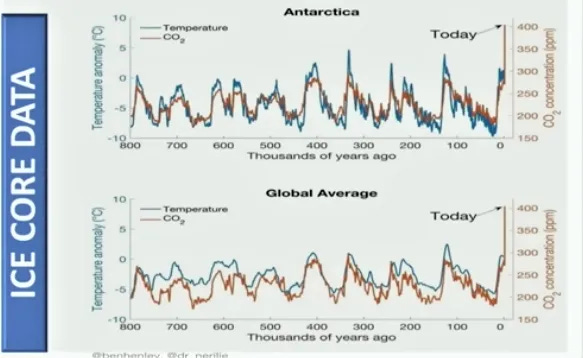
These temperature cycles have been going on for thousands and millions of years. Scientists can get this data from measuring ice cores at the poles that go back thousands of years. The CO2 is in brown and temperatures in blue. The obvious observation is that CO2 is way up but temperatures are not and still below some previous peaks. The data does show a correlation between CO2 and temperature.
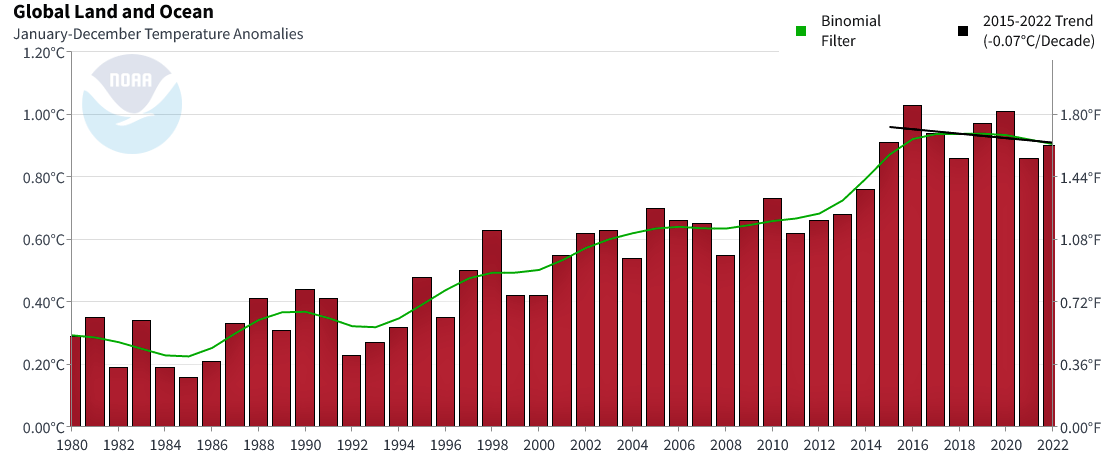
Have temperatures peaked or will they go higher? That is anyone's guess but data from the National Centers for Environmental Information below suggests the peak might be in. I really question the accuracy of the data, especially over the long term. It does not include data from many remote areas like the Sahara desert or mountainous regions for example. These temperatures are compared to an average from 1901 to 2000, was that a cooler period in normal cycles? Also consider that there were way fewer measuring stations 50 to 100 years ago. That said, the shorter term data should be more accurate. Temperatures have gone up around 1.0 degree Fahrenheit since the early 1980s. Other than a couple short term dips over 3 or 4 years in the 1980s and 90s, we now have a 7 year decline since 2015 of 0.07 degrees centigrade. It is not a long enough period to make any conclusions, but looking at the long term cycles above, we are certainly around a level where a peak could occur.
Temperatures change more at the poles than the global average so you will have a more dramatic effect on ice. Also consider the natural compounding of a warmer trend. Ice and snow reflect the sun and as there becomes less of this and more dark water surface area, more heat is absorbed from the sun, adding to longer periods of water and less ice. In past cycles, long before people were producing CO2, temperatures reversed and headed back down. This will happen again because these cycles are natural, caused by the sun, changes in earths orbit and tilt along with volcanoes and ocean currents.
And what about the recent forest fires? They add a lot of CO2 in the air. Dr. Werner Kurz is a Senior Research Scientist with Natural Resources Canada, and also leads the team that develops Canada's forest greenhouse gas inventories and the Forest Carbon Management Project. He says that 1.2 million hectares were burned in B.C. Canada during 2017. That number is over 4 million in 2023. However that 2017 number equated to 2 to 3 times more CO2 from forest fires than all the fossil fuel emissions for that year. But the impacts on the atmosphere are even greater because the many trees killed by fires will decompose over the next decades, releasing more carbon dioxide into the atmosphere. Also, trees killed by fires will not be removing carbon dioxide from the atmosphere as living trees would.


