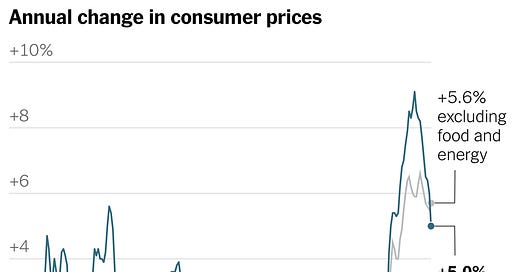
The market narrative still has it wrong. The belief is that inflation will continue to decline, hence interest rates with follow suit and decline. I believe inflation is entrenched and it is going to be much harder to bring down than the markets believe. In the chart below, you can see that core inflation is more stable and persistent than overall inflation.
The main reason that inflation came down in March is because the yearly numbers are comparing to much higher energy prices that began in March 2022. You can see it clearly on this chart of oil prices. Inflation is now measuring $70 oil in March 2023 to $110 oil in March 2022, so naturally energy is now pulling inflation numbers lower.
This easing of inflation is just temporary and will last to around August, assuming energy prices do not rise. By August we will be comparing the current energy prices against $80 to $90 oil in August 2022.
This next chart breaks down inflation by category and the energy sector decline is obvious. Also note that things you pay people to do, like make food for you at a restaurant or fly you across the country. Prices are rising accordingly, particularly across airlines, transportation and restaurants. It suggests consumer demand is still too high — first chasing limited goods and now chasing limited services, leading to increases in prices.
Gasoline prices were down -17.4% in the last CPI data, but these prices typically rise with the summer demand and you can see in the chart below that gasoline inventories are at precarious low levels.
This next chart is distillates that is mostly diesel fuel and these inventories are low as well. Any further supply disruptions like world geopolitical events, refinery problems or hurricanes and energy could easily start adding to the inflation numbers in the last half of 2023.
S&P Global’s April Flash US Composite PMI rose to 53.5—the highest reading since May 2022—for its third straight expansionary reading. Services activity growth reached its highest level in a year, increasing well above market expectations to 53.7. It appears the decline has ended and purchasing managers see a more resilient economy. Manufacturing PMI beat expectations more modestly, pointing to the first expansion in factory activity in 6 months.
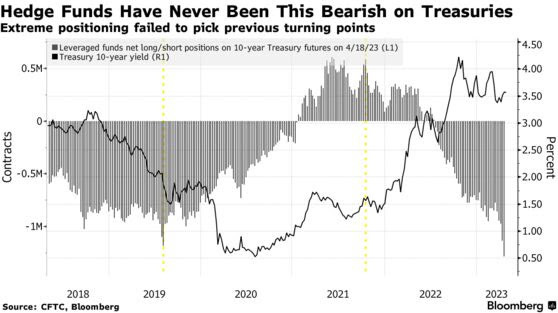
Hedge funds are not buying the declining rate narrative and they are probably right. They have never been more bearish on US Treasuries. Leveraged investor net shorts on 10-year Treasury futures have climbed to a record high after increasing for 5 consecutive weeks.
If the market narrative has it wrong as I suspect than owning stocks right now has considerable risk and we are still in an environment of rising costs, lower margins and profits. Expectations for the S&P earnings is a -6.2% decline. If this becomes the actual decline for the quarter, it will mark the largest earnings decline reported by the index since Q2 2020 (-31.6%). It will also mark the second straight quarter in which the index has reported a decrease in earnings. The chart does not look so bullish either.
There has been a decent bear market rally form the 3500 low but the index is close to a resistance level at 4200 to 4300 and we have a wedge pattern developing as well. Will we break lower or higher out of this wedge? Interesting is that a break over 4200 would also represent +20% in this rally, making it officially a new bull market. However, with the current and expected fundamentals I won't be buying it. General equities look too risky here and I prefer buying into a sector that is down and priced low, which brings me to energy.
Oil prices (WTI) started January 2022 around $75 and headed higher to around $120 by June, then declined back to $75 area by January 2023. Oil is now a bit above $75, so basically we have a wash as far as prices go. However many oil&gas stocks gave back far more than a wash and are priced back when oil was $60 to $65. Most of these same companies reduced debt significantly so now have better profit margins. I plan to highlight a few of these companies that I have been following and will start with -
Callon Petroleum - - - NY:CPE - - - $33.40 - - - - Market Cap $2.1 billion
Marketwatch reports that Callon is trading at a P/E of 1.75 and a price to book ratio of only 0.74. Granted this P/E is based on a pretty good year in 2022. However analysts are predicting earnings of around $10 per share in 2023 which would give a forward P/E of just 3.5, still very low.
Cash flow is another measurement often used to value oil&gas companies and the price to cash flow is a very low 1.53. The company had net cash from operating activities of $1.5 billion in 2022. Granted, 2022 was a very good year but if just look at Q4 when oil prices averaged around $83 to $84 they had cash flow of $372.6 million and multiplying by four to equate a year is still close to $1.5 billion. WTI Oil prices averaged $95 in 2022 and currently around $80 is not far off. I believe we will average between $75 to $80 for 2023 and to be more conservative, I will use an even $1 billion cash flow for 2023 so the stock is trading around 2 times that. Oil&gas stocks in the past often traded between 5 and 10 times cash flow. The sector is out of favour and cheap, especially Callon.
Callon's fourth quarter production averaged 106.3 MBoe/d (62% oil and 82% liquids), in line with guidance. Results reflect the negative impact of adverse winter weather, which is estimated at approximately 0.6 MBoe/d.
Average realized commodity prices during the quarter were $84.33 per Bbl for oil (102% of NYMEX WTI), $25.79 per Bbl for natural gas liquids, and $4.06 per MMBtu for natural gas (66% of NYMEX HH). Total average realized price for the period was $62.00 per Boe on an unhedged basis.
You can see that they had $372.6 million cash flow at $84.33 per Bbl so if average prices are $5 to $7 lower it will not be that negative.
What will help in 2023, is Callon paid down $461.9 million in debt and reduced leverage ratio, as defined by their credit facility, by over 40% over the last 12 months. They plan to continue paying down debt.
I have covered Callon in the past and for those of you not familiar with the company, this slide from their presentation is a good snap shot. They operate in well known and predictable basins.
"Callon's fourth quarter and full year performance drove new company records in profitability and cash flow," said Joe Gatto, President and Chief Executive Officer. "Our results demonstrate what our strong operational team plus a quality, oil-weighted asset base can do, profitably growing production while improving margins and investing less than 60% of our cash flow. We believe our business model is sustainable with a deep inventory of high-return oil projects that adhere to our "Life of Field" co-development model. Our cash flow will continue to be allocated to disciplined reinvestment, further debt reduction and eventual returns of capital as we pursue shareholder value creation from multiple sources."
I expect Callon will start paying a dividend this year. The company has stated that once they reach debt reduction down to $2 billion they will look at increasing shareholder returns.
At these valuations I don't see a lot of downside risk in the stock unless there is a collapse in oil prices, but with a war looking to continue this does not look likely. The stock is not much above good support on the chart so again little downside. The first important hurdle to clear on the upside is a break above $45.
All forecasts and recommendations are based on opinion. Markets change direction with consensus beliefs, which may change at any time and without notice. The author/publisher of this publication has taken every precaution to provide the most accurate information possible. The information & data were obtained from sources believed to be reliable, but because the information & data source are beyond the author's control, no representation or guarantee is made that it is complete or accurate. The reader accepts information on the condition that errors or omissions shall not be made the basis for any claim, demand or cause for action. Because of the ever-changing nature of information & statistics the author/publisher strongly encourages the reader to communicate directly with the company and/or with their personal investment adviser to obtain up to date information. Past results are not necessarily indicative of future results. Any statements non-factual in nature constitute only current opinions, which are subject to change. The author/publisher may or may not have a position in the securities and/or options relating thereto, & may make purchases and/or sales of these securities relating thereto from time to time in the open market or otherwise. Neither the information, nor opinions expressed, shall be construed as a solicitation to buy or sell any stock, futures or options contract mentioned herein. The author/publisher of this letter is not a qualified financial adviser & is not acting as such in this publication


Great analysis Ron. The only minor negative I see for Callon is the rapid decline curves on shale wells. However, it seems like they have a good inventory of prospects and as you point out very low multiples.👍