Economy News, Trump Soaring, Gold and More Gold, New Gold (NGD)
Today the ADP said that 233,000 jobs were created this past month, significantly beating expectations. According to consensus estimates, economists were looking for job gains of around 110,000. I am not surprised as I commented I expect a strong job report Friday ahead of the election. This is also supporting that prediction.
“Even amid hurricane recovery, job growth was strong in October,” said Nela Richardson, chief economist, ADP. “As we round out the year, hiring in the U.S. is proving to be robust and broadly resilient.”
Than again, the U.S. economy is showing more signs of cooling as activity slowed more than expected between July and September. The Bureau of Economic Analysis presented the first look at the third-quarter Gross Domestic Product on Wednesday; the economy grew 2.8% in the last three months, down from 3.0% in the second quarter.
The increase in real GDP primarily reflected increases in consumer spending, exports, and federal government spending. Activity missed economists' expectations as consensus forecasts were looking for a reading at 3.1% at market watch.
The best economic news was, U.S. consumer confidence surges in October to highest level in nine months. Index hits 108.7 versus forecast of 99.5. Americans in the survey said they became more upbeat over recent stock market gains and lower interest rates, while signalling plans to purchase big-ticket items in the near future.
Trump's lead in polls continues to grow and polymarket now has him at 66.8% and Harris down to 33.2%. The good news is it looks like Republicans could take the House too. I say this is good news because it will give Democrats no good path to stop Trump as President. As I said, markets hate uncertainty so if the election is decisive either way that is good news. My analysis showed markets did better under Trump than Biden/Harris and Trump's America first policies will benefit U.S companies/stocks.
World Gold Council Q3 Data
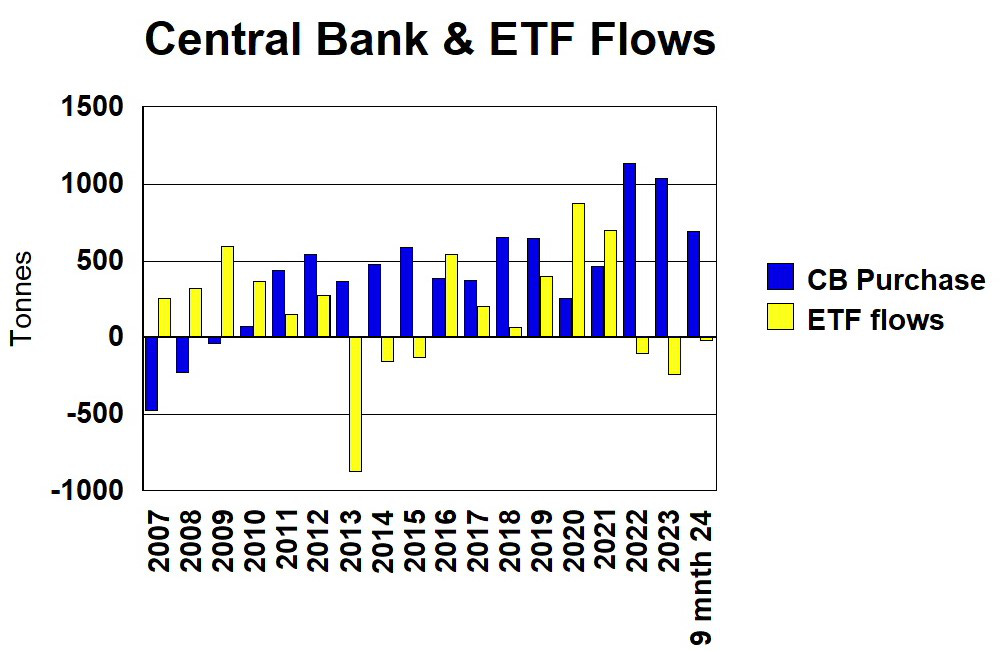
Late yesterday the World Gold Council released their Q3 data and there was some positive news on ETFs. I have updated my charts as well.
Inflows into ETFs has reversed and was positive by 95 tonnes, almost bringing the YTD number almost even. Global physically-backed gold ETFs halted their nine-quarter run of outflows, with 95t of inflows in Q3. All regions saw positive inflows during the quarter, which ended with collective holdings of 3,200t. I have been commenting about lack of North America buying for at least a year. It appears they are finally and slowly getting on board. Next year we should be back to levels of 202 and 2021. This will be fuel for a continued bull market.
Central Banks added another 186 tonnes and the pace is below the record set in 2023 but we have 3 months to go. One reason numbers are a little lower is China has not been reporting any buying but does not mean they are not buying. China often does not report their buying until later, hoping to keep prices softer for their constant accumulation.
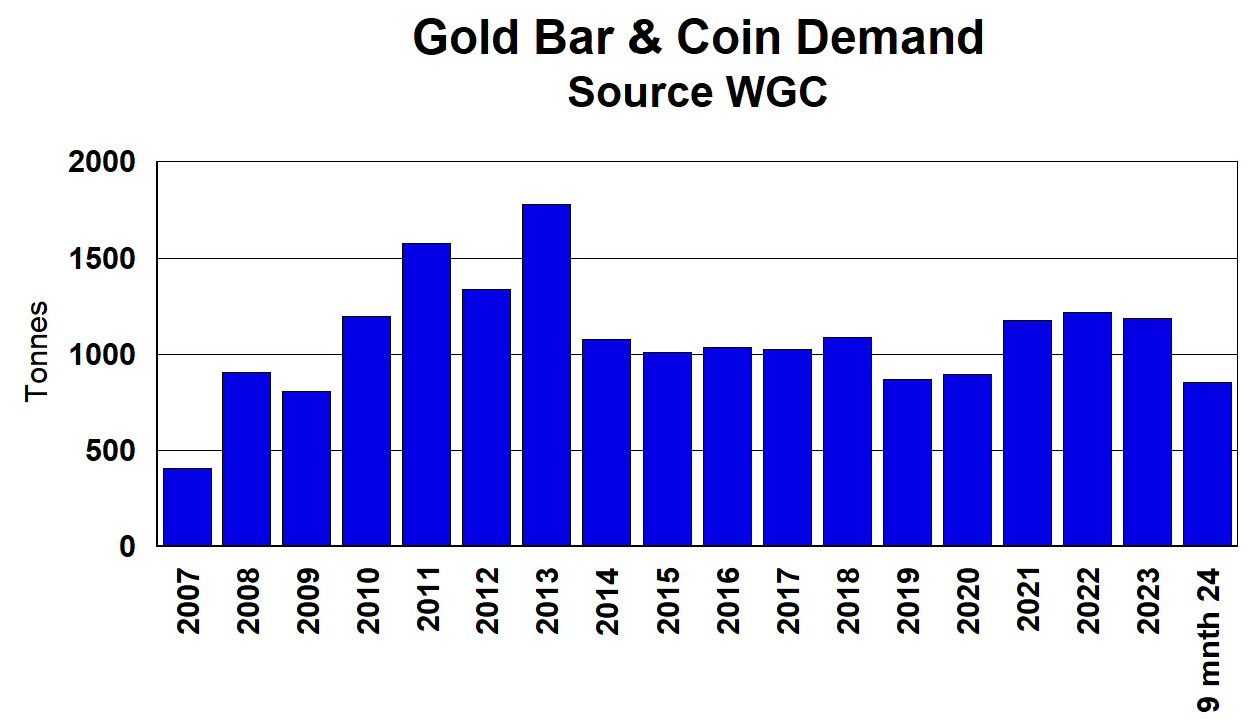
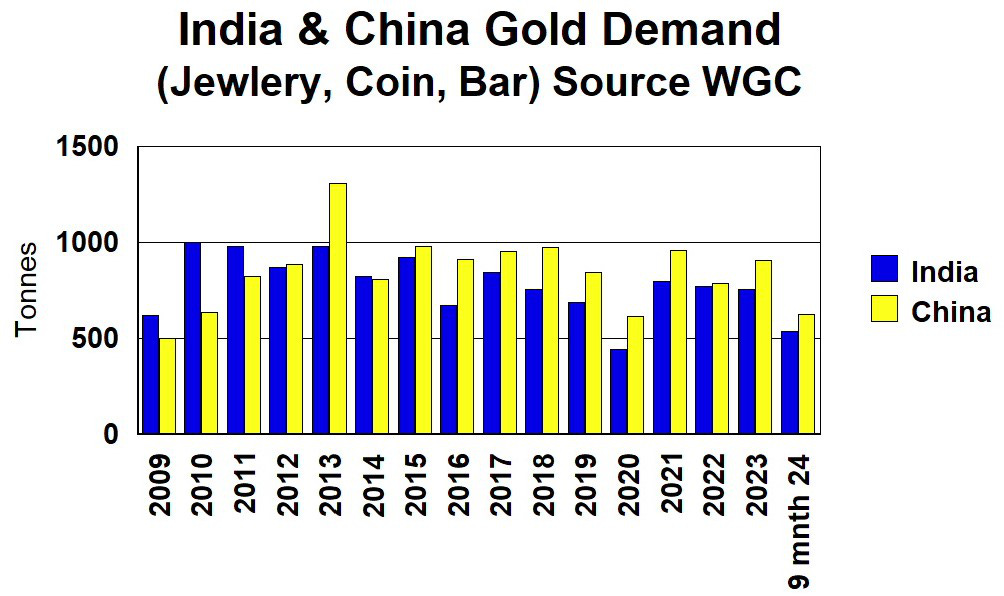
Physical investment demand remains about flat outside the CBs. At some point when the west starts buying we will see a surge like 2007 to 2013. The stable buying in the past 10 years is mostly eastern buying especially the usual suspects, India and China.
You can see India and China demand has remained strong since the 2013 peak, other than the 2020 plandemic dip.
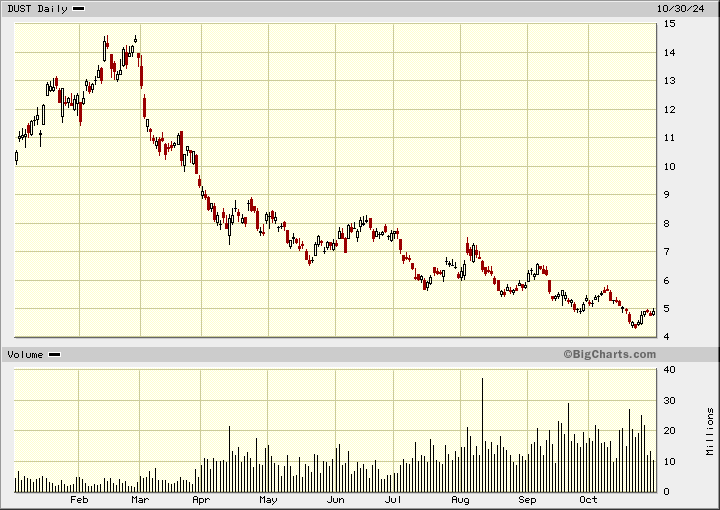
Retail investors continue to bet against the gold stocks as there is still way more volume in the (DUST) etf (2 times short) than the 2 times long (NUGT) etf. This is good, we will want their buying later on in this bull market.
The gold bugs index HUI, did get up 354 but still has not broke 375 which I am looking for as a solid breakout above the 2020 highs.
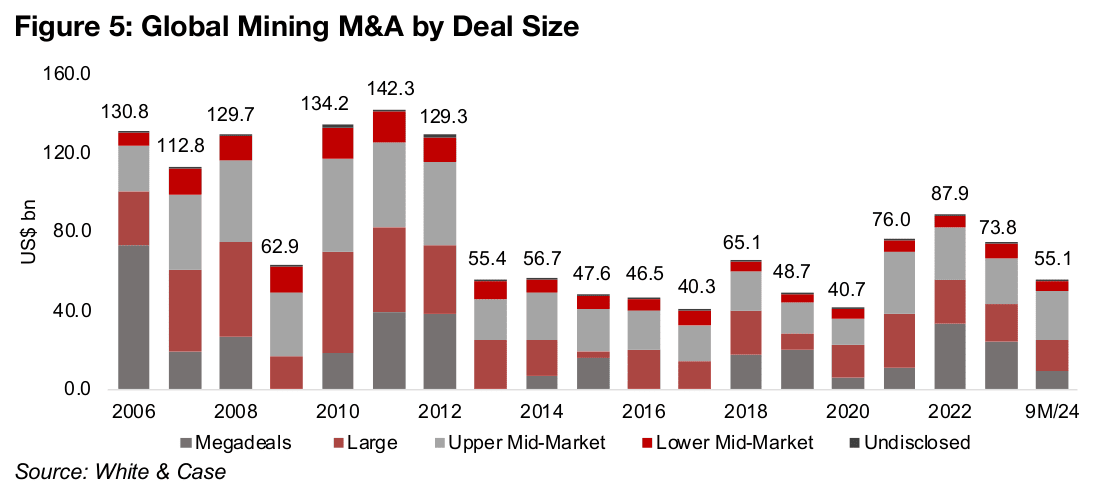
These low valuations for mining have continued to encourage M&A in the sector globally, with White & Case reporting US$55.1bn in acquisitions at 9 months 2024, putting the sector on track to reach a similar level to the US$73.8bn of 2023. There has been less Mega large deals but, the total value of large and upper mid-market deals has been strong, at US$16.1 and US$24.9bn for9M/24, already near full year 2023 levels.
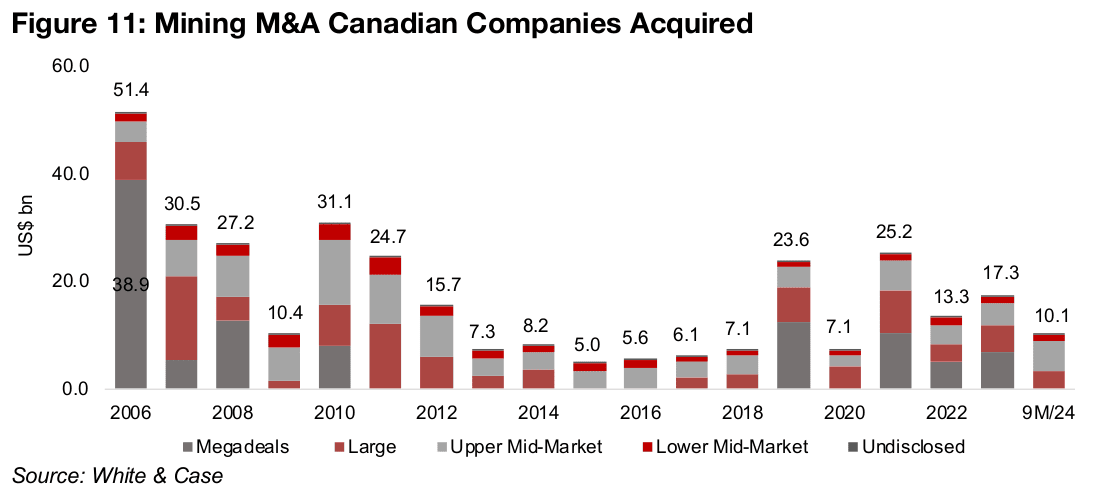
While the Lower Mid-Market segment has not seen the major increase of the large and upper mid-market segments as a proportion of total deal value in 9M 2024, at 9.1% it is similar to the 9.3% of 2023 and well off of the lows. Don't be concerned that values are below 2010 to 2012 and before because remember, mining stocks had much higher valuations back in those days. That will return again as this bull market progresses. This next chart on the number of Canadian companies acquired shows it is way above the depressed M&A years of 2012 to 2018 and not that far below the numbers at the top of the last bull market.
This is all very bullish as more and more miners are taken off the market giving investors fewer to buy. NGD reported Q3 results today.
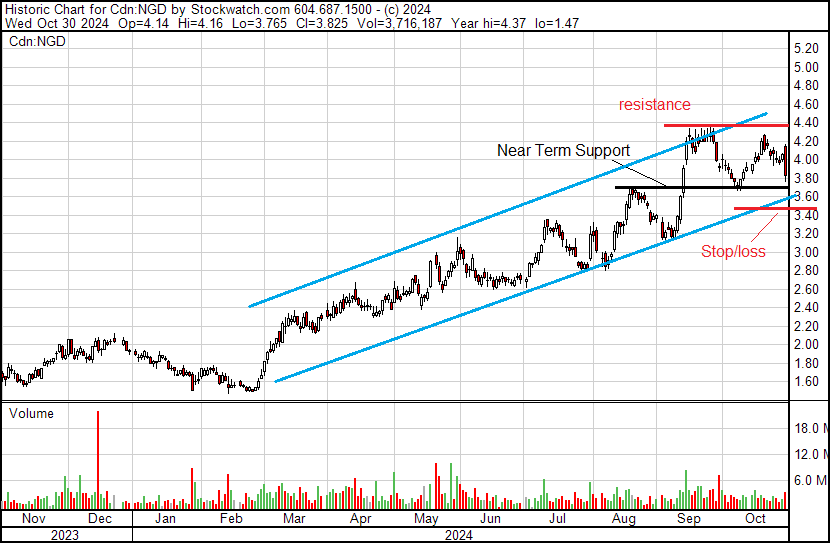
New Gold - - - NY/TSX: NGD - - - - Recent Price - C$3.85
Entry Price - $2.55 - - - - Opinion – hold, raise stop/loss to C$3.50
Third quarter 2024 production was 78,369 gold ounces and 12.6 million pounds of copper, at operating expenses of $1,021 per gold ounce sold (co-product basis) and all-in sustaining costs of $1,195 per gold ounce sold (by-product basis). The strong cost performance and higher metal prices, resulting in record cash flow from operations of $128million and record free cash flow of $57 million.
Third Quarter Delivers Highest Production and Lowest Costs This Year and NewGold expects trends to continue into Q4.
"New Afton delivered a strong operating quarter and completed critical C-Zone milestones ahead of schedule, while Rainy River delivered costs as planned, with all-in sustaining costs 29% lower quarter-over-quarter," stated Patrick Godin, President and CEO. "The Company continues to expect the fourth quarter of 2024 to be its strongest quarter of the year, concluding a successful year that has seen New Gold reach its free cash flow inflection point and deliver on key project milestones in pursuit of our objective to target a sustainable production platform of approximately 600,000 gold equivalent ounces per year until at least 2030."
New Afton third quarter production was 16,477 ounces of gold and 12.6 million pounds of copper at all-in sustaining costs of ($408) per gold ounce sold (by-product basis). The B3 cave continues to perform as planned, and C-Zone ore production is ramping up concurrently with construction of the cave footprint. Commercial production from C-Zone and crusher commissioning occurred early in the fourth quarter, two months ahead of schedule.
Rainy River third quarter production was 61,892 ounces of gold at all-in sustaining costs of $1,327 per gold ounce sold (by-product basis). Although Rainy River achieved the highest production quarter year-to-date, operations were impacted by a voluntary suspension following a fatality in July, after which open pit production gradually returned to full capacity.
The Company delivered record quarterly revenue of $252 million, record cash flow from operations of $128 million, and record free cash flow1 of $57 million, driven by higher metal prices, operational discipline and efficient capital management.
The forecast was downgraded some with a bit lower production expected at Rainy River. The market is still focused on any bad news so the stock dipped about 20 cents, close to near term support.
Gold production is expected to be in the range of 300,000 to 310,000 ounces (previously 310,000 to 350,000 ounces). New Afton gold production is expected to be at the top end of the guidance range of 60,000 to 70,000 ounces. Rainy River gold production is expected to be in the range of 230,000 to 240,000 ounces (previously 250,000 to 280,000 ounces).
All forecasts and recommendations are based on opinion. Markets change direction with consensus beliefs, which may change at any time and without notice. The author/publisher of this publication has taken every precaution to provide the most accurate information possible. The information & data were obtained from sources believed to be reliable, but because the information & data source are beyond the author's control, no representation or guarantee is made that it is complete or accurate. The reader accepts information on the condition that errors or omissions shall not be made the basis for any claim, demand or cause for action. Because of the ever-changing nature of information & statistics the author/publisher strongly encourages the reader to communicate directly with the company and/or with their personal investment adviser to obtain up to date information. Past results are not necessarily indicative of future results. Any statements non-factual in nature constitute only current opinions, which are subject to change. The author/publisher may or may not have a position in the securities and/or options relating thereto, & may make purchases and/or sales of these securities relating thereto from time to time in the open market or otherwise. Neither the information, nor opinions expressed, shall be construed as a solicitation to buy or sell any stock, futures or options contract mentioned herein. The author/publisher of this letter is not a qualified financial adviser & is not acting as such in this publication.


