


Economy/Market Bubble, Yen Carry Trade, Oil, Nat Gas Up
'BIR, HEM, GILT

Bubble Bubble ends in Trouble
Markets are very bubbly and hopeful with Trump's promised policies but lets see what he gets done and what works because the challenges are quite large. Economic indicators and trends don't support the irrational exuberance as Greenspan once put it. I have been warning of a bubble top and often the precise top is tough to call. I was pretty much bang on 1999/2000 dot come bubble and a bit early on the 2007/08 mortgage bubble. Right on with the Canada Real Estate bubble top. It looks like I am a bit early again, but later when we look back in hindsight, market percentage wise I will probably be close.
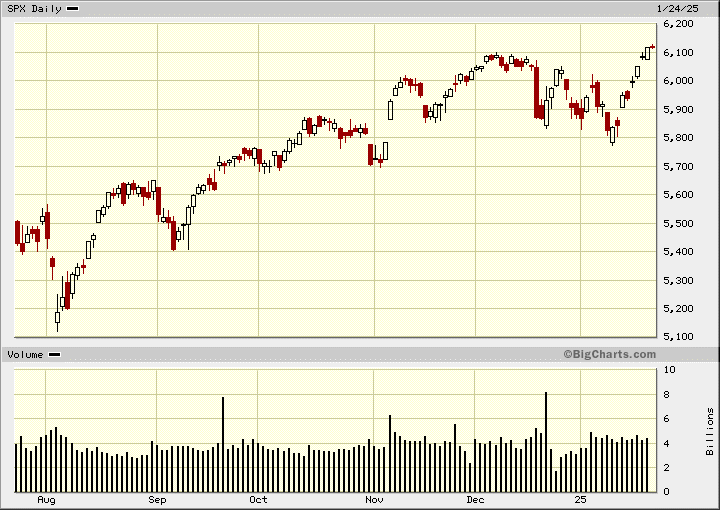
The S&P500 has made new record highs although not very convincingly yet. The NASDAQ shows a double top and the DOW is still about 500 points below it's last top and the DOW Transports are not confirming a strong move. I am starting to get some company with my bubble top theory.
In a note to clients, a group led by JPMorgan’s chief markets strategist Marko Kolanovic laid out their case for a bearish outlook for equities even as historically strong sentiments among investors prevail.
UBS global equity strategist Andrew Garthwaite put together his bubble checklist, as he compared current conditions to the dot-com bubble of the late 1990s and the Japanese asset bubble of the 1980s. The stock market is not yet in a bubble - but it's getting closer, and six out of seven conditions for one have already been met, he says. I would say 6 out of 7 pretty much says bubble?
I will have some more detail in my 2025 outlook to come.
On economic news, the leading indicator index posted a 0.1% decline as the year ended, following an upwardly revised 0.4% gain in November. However, the six-month trend of the index improved, with it falling 1.3% over the past six months compared to 1.7% in the prior period. This indicator has been negative for a long time which would normally result in recession by now, but not so yet.
New applications for unemployment insurance rose to 223K for the week ending January 18, as reported by the US Department of Labor yesterday. This print missed initial estimates and was higher than the previous week's unrevised tally of 217K. Moreover, Continuing Jobless Claims went up by 46K to reach 1.899M for the week ending January 11.
U.S. home sales rose 2.2% last month to a seasonally adjusted annual rate of 4.24 million units, the highest level since February, the National Association of Realtors said today. In a better context, a total of 4.06 million previously owned houses were sold last year, the lowest number since 1995.
U.S. business activity slowed to a ninth-month low in January amid rising price pressures, but still above 50 indicating expansion. S&P Global said today that its flash U.S. Composite PMI Output Index, which tracks the manufacturing and services sectors, declined to 52.4 this month
The Michigan Consumer Sentiment Index, a key measure of consumer confidence, has recorded a lower-than-expected figure in its latest release. The index, compiled by the University of Michigan, came in at 71.1, falling short of the forecasted 73.2. This is the first decline in 6 months and may indicate that despite Trump optimism, real world factors are hitting consumers.
All told, these recent numbers don't point to a booming economy and stock market. Take out the AI mania in the stock market and it does not look so good.
Japanese Yen Carry Trade
I am closely watching the Japanese yen because the unravelling of the yen carry trade last year triggered a hefty market correction. The US$ index has been dropping the past week as Trump's win may be starting to where off. The yen has not gone up much yet but looks like it has bottomed.
Japan, things are going in the opposite direction. The BOJ just hiked its key policy rate to its highest level in 17 years, continuing its hawkish stance after exiting an era of unconventional policy. It's important to note that rates in Japan are still comparatively low, in a range of "around 0.5%," but there are plans to keep pushing up borrowing costs toward levels seen in other major economies.
This chart of the yen is weekly and last July when the yen moved up to 69, the carry trade started to unwind and U.S. stocks sold off sharply. As a reminder, traders borrow Yen with the low interest rates and buy higher yielding U.S. stocks. As long as the Yen goes down or stays pretty even, the trade works great. There is no problem here yet, but with Japan in a tightening cycle, it is something to watch carefully.

Because Trump says 'drill baby drill' does not mean it will happen as US oil service giant Halliburton (NYSE:HAL) warned of a deceleration in drilling activities across North America. They reported a $615 million profit in Q4 2024, with sales dipping 7% quarter-over-quarter in the United States to $2.2 billion on ‘softer’ demand. To be fair this reflects the Biden ear and maybe why inventories are low. As this chart shows U.S. oil stocks remain at multi year lows and Trump claims he is going to fill the Strategic Reserves back up. Right now this will be very hard to do and on top of this, if he puts tariffs on Canadian oil it will just be a bigger problem. It makes no sense to tariff Canadian oil exports to the U.S., but just because it makes no sense does not mean it won't happen for political reasons. My feeling is Trump is using tariffs more as a threat and bargaining tool, time will tell.

Natural Gas prices are in rally mode as the Arctic blast drives record 270 Bcf storage withdrawal, testing technical resistance at $4.053 as traders eye bullish breakout. Also southern oil&gas wells are not built for cold weather so Texas freeze-offs constrain production while European LNG demand rises.
There is still ample gas in storage, but we may get a colder winter yet as this may only be the first cold blast. I warned about an extreme polar vortex this year that often stays put, but this one moved south once now. Will it do it again? Also summer demand should keep increasing driven by electricity demand for data centers.
Since 2015, the number of data centers worldwide has doubled to 7,000. This growth trend could intensify as companies shift data to remote cloud services. World governments, including the United States, Japan, China, Germany, the UK, India, and others, are also racing to build their own artificial intelligence (AI) hubs, fueling the growing demand for data center infrastructure. It is not only AI but with government and big tech's obsession of storing every tidbit of data every person generates just keeps swelling as we communicate more.
As of last November, Deloitte forecasts that global data center electricity usage could nearly double from 536 terawatt-hours (TWh) in 2025 to approximately 1,065 TWh by 2030.
As cited by Data Center Dynamics, analysts from S&P Global project that data centers could require up to 3 billion cubic feet per day (bcf/d) of natural gas by 2030, with potential increases to 6 bcf/d depending on the energy mix. This surge is attributed to the need for reliable, continuous power to support data center operations.

Nat Gas prices have been testing $4 and if they can break that it could easily run to over $5.00 especially if we get a 2nd cold snap.
Birchcliff Energy - - - - TSX:BIR - - - - Recent Price - $6.00
Entry Price - $8.65 - - - - Opinion - hold
I had numerous buys when the stock was down, now lets see how much higher it can go. Birchcliff announced they reduced their annual dividend to 12 cents from 40 cents. This might come across as bearish but it is actually bullish as the company is changing their conservative stance to one of growing production again.
Chris Carlsen, Birchcliff's president and chief executive officer, commented "Over the last few years, our industry faced depressed natural gas prices driven by several factors, including constrained natural gas egress and a challenging political environment, during which time we limited growth, maintained a relatively flat production profile and focused on shareholder returns, paying approximately $390-million ($1.47 per common share) to our shareholders through common share dividends. With the landscape for natural gas demand significantly improving and given our strong asset performance in 2024, we believe that it is in the best interests of the corporation to shift our capital allocation strategy to focus on investing in and profitably growing our business, strengthening our balance sheet and providing a base dividend that is more sustainable through commodity price cycles. We believe that this strategy will allow us to deliver significant shareholder value.
To that end, we have updated our five-year plan for 2025 to 2029 and made the decision to reduce our annual base dividend to 12 cents per common share, which will allow us to invest in our world-class asset base, profitably grow our production and strengthen our balance sheet, which will improve our financial flexibility. Our updated five-year plan allocates capital towards fully utilizing our existing infrastructure and firm transportation capacity to reach production of 87,500 boe/d in the second half of 2027, achieving production growth of approximately 14% over the next three years.”
Analysts seem to like the change too. In the Globe and Mail, National Bank Financial analyst Dan Payne has elevated his recommendation for Birchcliff Energy to "outperform" from "sector perform." Mr. Payne jacked his share target higher by $2 to $8. Analysts on average target the shares at $6.91. Mr. Payne upgraded Birchcliff amid "optimism for structural change" in the North American gas market and pointed to its strategic pivot to "reinvestment from income."

Similar to Natural Gas , if Birchcliff can break $6.50 it should easily go over $7.00.
Only 3 weeks into the year and we have a first stock with over a 100% gain, Hemostemix HEM hit $0.42 today. I guess the investor conference in Puerto Rico went well. Here is another newsletter article out today. https://equity.guru/2025/01/23/hemostenix-hemo-v-bringing-back-that-lovin-feeling/
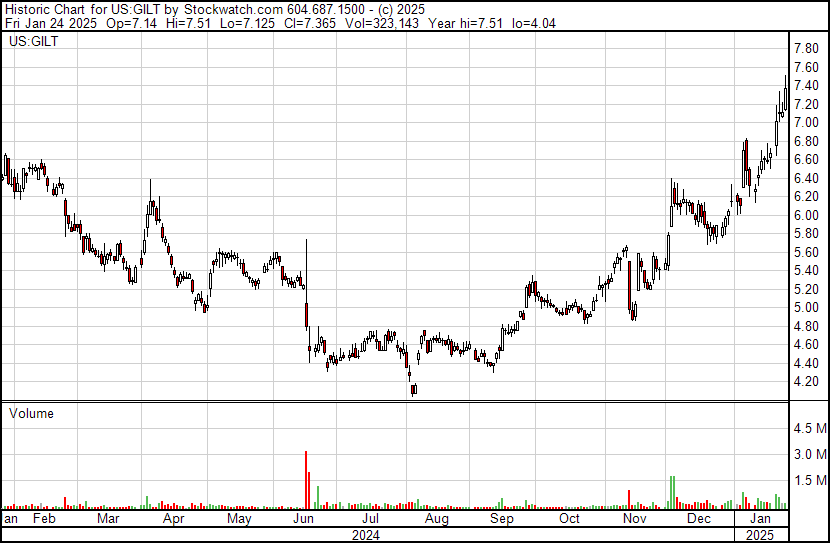
I have been commenting about Gilat Satellite NASDAQ:GILT potential for breaking out and it looks to be happening today as it hit $7.50 well above $7.20, I was watching.
All forecasts and recommendations are based on opinion. Markets change direction with consensus beliefs, which may change at any time and without notice. The author/publisher of this publication has taken every precaution to provide the most accurate information possible. The information & data were obtained from sources believed to be reliable, but because the information & data source are beyond the author's control, no representation or guarantee is made that it is complete or accurate. The reader accepts information on the condition that errors or omissions shall not be made the basis for any claim, demand or cause for action. Because of the ever-changing nature of information & statistics the author/publisher strongly encourages the reader to communicate directly with the company and/or with their personal investment adviser to obtain up to date information. Past results are not necessarily indicative of future results. Any statements non-factual in nature constitute only current opinions, which are subject to change. The author/publisher may or may not have a position in the securities and/or options relating thereto, & may make purchases and/or sales of these securities relating thereto from time to time in the open market or otherwise. Neither the information, nor opinions expressed, shall be construed as a solicitation to buy or sell any stock, futures or options contract mentioned herein. The author/publisher of this letter is not a qualified financial adviser & is not acting as such in this publication.