As an update on yesterday's comments on oil. U.S. crude stockpiles posted their fifth straight weekly decline, marking the longest string of crude drawdowns since a seven-week streak at the end of 2021. Crude still tallied losses in July, with WTI and Brent falling 4.4% and 6.6%, respectively.
We are about to enter a mega bull market in precious metal stocks that I think will rival the 1970s early 1980s bull market. We have a vert similar situation I have been commenting about the last few years called 'stagflation'.
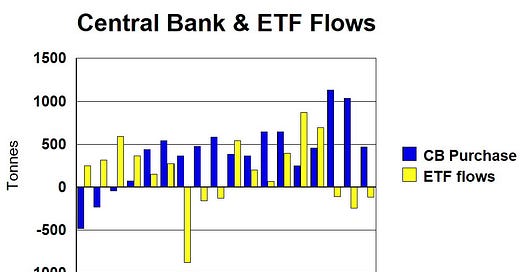
That 70s/80s bull market was driven by a flight out of US$ when President Nixon closed the gold window in 1971. US$ could no longer be converted into gold. Today the same thing is happening but somewhat different circumstances. Central Banks (CBs) are selling US$ and Euros assets and buying gold. For the first time, CBs hold more gold that Euros and before long will be more than US$. The latest gold numbers just came out from the World Gold Council so I updated my charts that include this one on CB and ETF positions. I am doing a make over on the web site gold page.
Central Banks have been steadily buying gold since the 2008 financial crisis but really ramped this up in 2022 and 2023 with inflation, massive US debt and the Biden Administration policy of weaponizing the dollar. Judging by the 1st half 2024 number the CBs look to be on about the same buying pace as 2022 and 2023.
ETF flows have been negative and Open Interest on Comex Gold contracts has barely moved higher. This has dumb founded many investors so they can't understand and believe in this bull market so far. The main thing they don't understand is the CBs are sucking the gold out of the ETFs and Comex gold contracts. Reading this newsletter and this information gives you a big advantage as we are buying in well ahead of the crowd. When ETF flows turn positive we will probably be well under way to $2,500 to $3,000 gold prices.
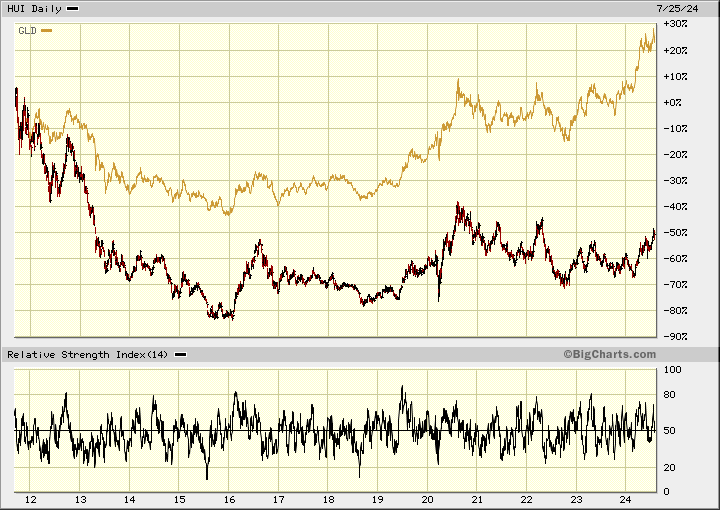
Gold stocks are still lagging the gold price a lot and offer a lot of value. The junior explorers still remain close to their bottoms. This chart compares gold (GLD) to the HUI gold bugs index since the 2011 peak. Gold stocks normally out perform gold but you can see they have a long way to go just to catch up with gold. Currently the gap is about 80%.
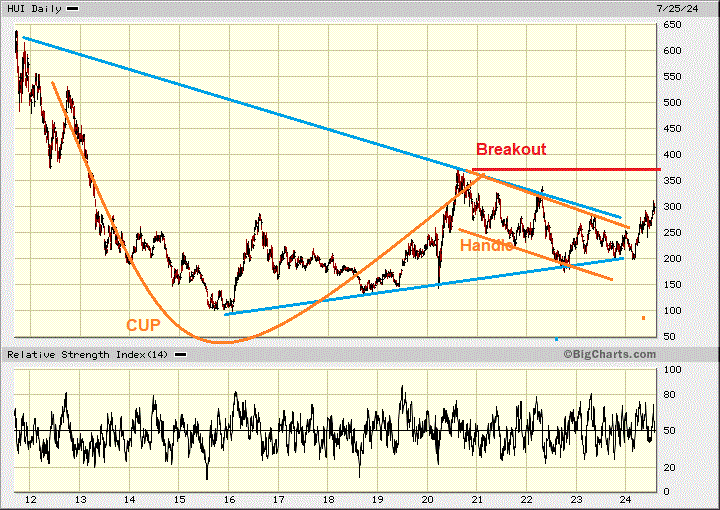
My next chart is a long term one of the HUI index since the last top in 2011. There is two long term patterns on the chart underway.
First we have a long term wedge pattern indicated by the blue lines. The HUI broke out of this to the upside in May.
2nd there is a long term cup and handle formation. I could have spent more time drawing a better cup but it is there. The break out from this will be a big deal. The HUI is now about 310 and the break out is about 375 and that is only about a 20% move higher. It is going to happen this fall/winter. Could be sooner with all the uncertainties abound.
Argonaut Gold Now Alamos Gold.
With the court-approved plan of arrangement, shareholders received 0.0185 of a Class A common shares of Alamos and 0.1 of a common share of Florida Canyon, the spinout for each Argonaut share.
Florida Canyon - - — TSXV:FCGV - - - - - - Recent Price - $0.54
Entry Price - $0.60 - - - - - — - - Opinion - hold
The stock has mostly traded between $0.53 and $0.66 so I am picking an entry price of an even $0.60.
Florida Canyon is a spinout of the U.S. and Mexican operations of Argonaut Gold Inc., including the Florida Canyon mine in Nevada, United States, and the San Agustin mine in Mexico. The corporation also holds El Castillo mine, La Colorada mine, the Cerro del Gallo project and the San Antonio project (which is subject to an option agreement with Heliostar Metals Ltd.), all located in Mexico. FCGV now has equivilant gold production of about 70,000 ouncess per year.
FCGV has entered into a binding agreement to sell its interests in the San Agustin mine, El Castillo mine, La Colorada mine, Cerro del Gallo project and San Antonio project to Heliostar Metals Ltd. Also as part of Alamos deal, Alamos is now a 19.99% shareholder.
Then on July 29th Integra Resources, TSXV:ITR agreed to acquire all of the issued and outstanding shares of FCGV pursuant to a court-approved plan of arrangement. The Transaction will create a diversified, Great Basin-focused gold (“Au”) and silver (“Ag”) producer with immediate gold production of approximately 70 thousand ounces (“kozs”) of gold equivalent (“AuEq”)(1) per annum from the Florida Canyon Gold Mine (“Florida Canyon”), coupled with a built-in growth pipeline of high-quality development stage assets including the DeLamar Project (“DeLamar”) and the Nevada North Project (“Nevada North”).
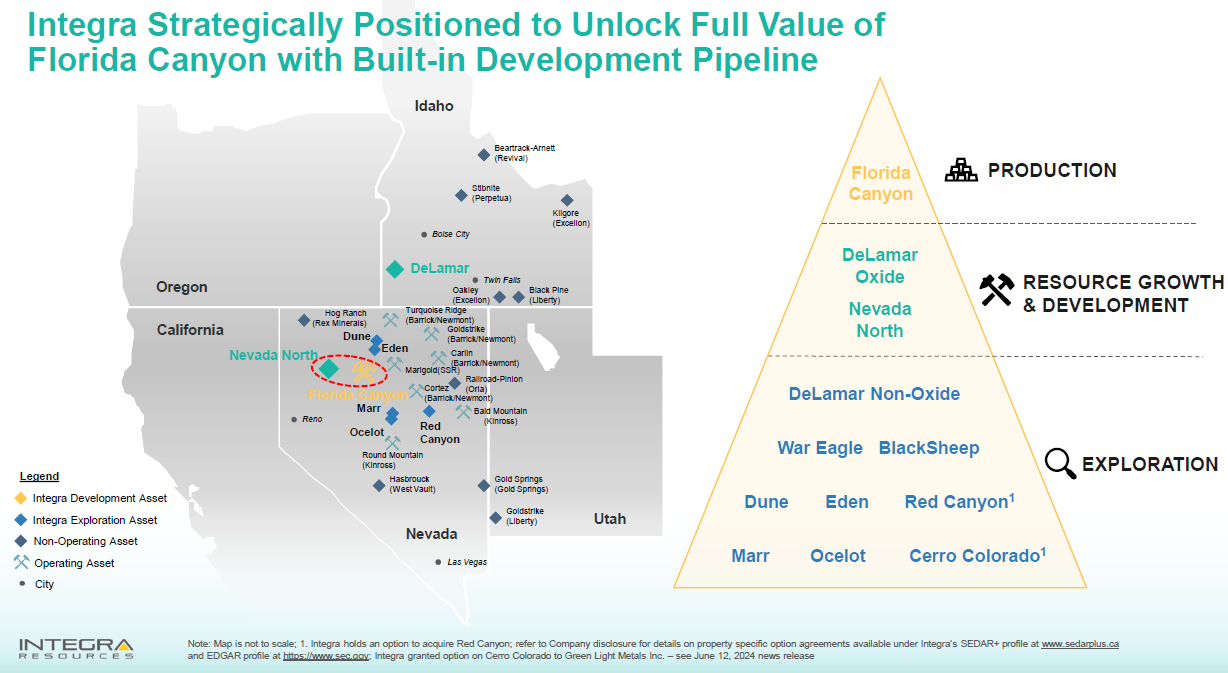
Under the terms of the Transaction, FCGI shareholders will receive 0.467 of a common share of Integra (each whole share, an “Integra Share”) for each common share of FCGV. Therefore I will make another adjustment to our entry price when this deal closes. Integra has a very large portfolio of exploration assets as you can see in this slide from their presentation.
I was not all that happy how Argonaut management handled the development of Magino mine that Alamos has taken over so I think it is a good thing that the new board with the Integra merger will be six members from Intergra and just two from Florida Canyon. And I don't believe there is any management from Argonaut moving into this new company. I plan to wait to after the merger and look into all the assets some more before deciding to put a buy or hold on the stock.
Since we have an entry price of $0.60 on Florida Canyon, it translates into 6 cents on the old Argonaut shares. Our entry price on Argonaut was $0.30 so subtract $.06 we have an adjusted entry price of $0.23. and since we got 0.0185 Alamos shares for every Argonaut share it gives us an entry price on Alamos of $12.43.
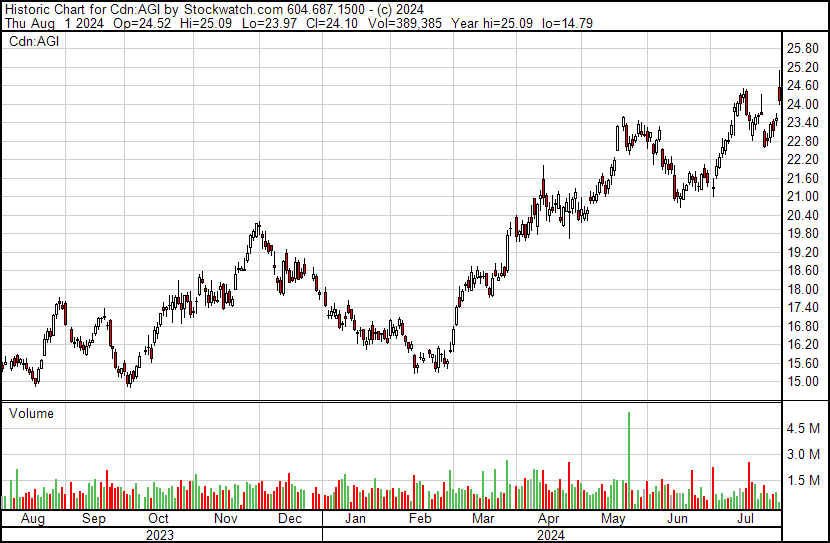
Alamos Gold - - - - TSX:AGI, NY:AGI - - - - - Recent Price - C$24.24
Entry Price - C$12.43 - —- - - - - Opinion – hold
I have followed this company for decades as it is one of the best gold producers. Alamos shares have been on a tear since March when we last bought Argonaut before the takeover announcement so we have a very nice gain already of almost 100%. The stock is at all time highs and well above the bull market highs of 2011 around $21.
They just reported very strong Q2 results yesterday. “Alamos delivered a record performance in the second quarter. Production exceeded quarterly guidance, increasing to a record 139,100 ounces. Combined with lower costs, this drove a number of financial records including free cash flow of $107 million,” said John A. McCluskey, President and Chief Executive Officer. “We also continue to create value through exploration and our various growth initiatives. The Phase 3+ Expansion is progressing well, and the integration of Island Gold with our recently acquired Magino mine is well underway. We expect the integration of the two operations to drive substantial synergies and unlock significant longer-term upside potential supported by the broad-based exploration success we are seeing across the Island Gold District. We remain well positioned to achieve full year guidance, and deliver significant production growth, at declining costs over the next several years,” Mr. McCluskey added.
Second Quarter 2024 Operational and Financial Highlights
Produced a record 139,100 ounces of gold, exceeding quarterly guidance of 123,000 to 133,000 ounces, driven by strong performances from Island Gold and La Yaqui Grande.
Sold 140,923 ounces of gold at an average realized price of $2,336 per ounce, generating record quarterly revenue of $332.6 million. This represented a 27% increase from the second quarter of 2023 and marked the second consecutive quarter of record revenue.
Record free cash flow1 of $106.9 million, reflecting strong mine-site free cash flow from all three operations, including quarterly free cash flow of $69.9 million at Mulatos and record quarterly free cash flow from Young-Davidson of $40.1 million. This was a significant increase from consolidated free cash flow of $24.4 million in the first quarter of 2024, while continuing to fund the Phase 3+ Expansion at Island Gold
Record cash flow from operating activities of $194.5 million (including $190.6 million, or $0.48 per share before changes in working capital1), an 80% increase from the first quarter of 2024 reflecting strong operating performance and margin expansion
Cost of sales of $172.6 million or $1,225 per ounce were in line with full year guidance
Total cash costs1 of $830 per ounce and all-in sustaining costs ("AISC"1) of $1,096 per ounce decreased 9% and 13%, respectively, from the first quarter of 2024, driven by higher grades at both Island Gold and Young-Davidson
Adjusted net earnings1 for the second quarter were $96.9 million, or $0.24 per share1. Adjusted net earnings includes adjustments for net unrealized foreign exchange losses recorded within deferred taxes and foreign exchange of $15.9 million, and other adjustments, net of taxes totaling $10.9 million. Reported net earnings were $70.1 million, or $0.18 per share
Cash and cash equivalents increased 31% from the first quarter of 2024 to $313.6 million on June 30, 2024. This was net of a $36.9 million private placement into Argonaut Gold ("Argonaut") in April, and ongoing investment in the Phase 3+ Expansion. The Company was debt-free as the end of the second quarter. Subsequent to quarter-end, the Company drew down $250 million on its credit facility to extinguish Argonaut's term loan, revolving credit facility and gold prepaid advance of 10,000 ounces, all inherited as part of the acquisition.
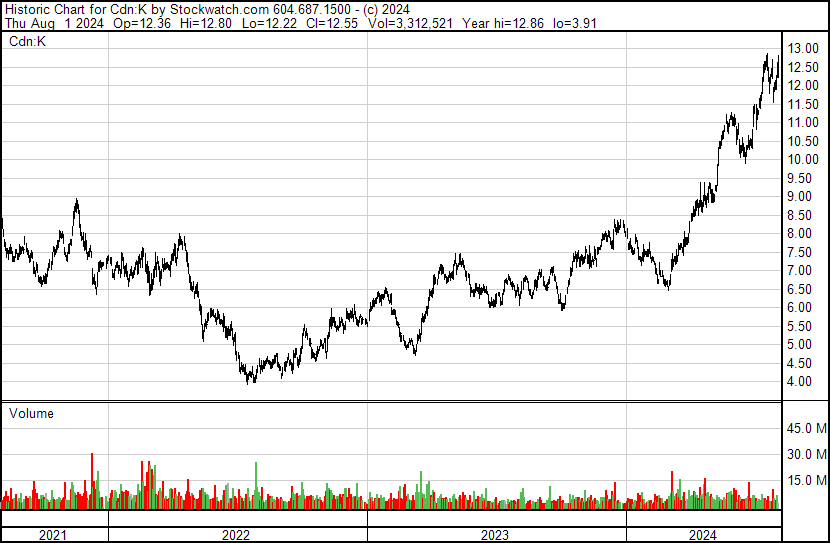
Kinross Gold - - - - TSX:K, NY:KGC - - - - - Recent Price - C$12.43
Entry Price - C$6.35 - - - - - - - Opinion – hold
Kinross is another one of our gold producers making new highs, in fact 4 year highs. They announced Q2 results yesterday. Robust margins and significant free cash flow enabled $200 million debt repayment. Positive progress at all growth projects including first gold produced from Manh Choh project.
2024 second-quarter highlights:
Guidance reaffirmed: On an attributable basis, Kinross remains on track to meet its 2024 annual guidance for production, cost of sales, all-in sustaining cost and capital expenditures.
Production of 535,338 gold equivalent ounces (Au eq. oz.).
Production cost of sales of $1,029 per Au eq. oz. sold and all-in sustaining cost1 of $1,387 per Au eq. oz. Sold.
Margins increased to $1,313 per Au eq. oz. sold, outpacing the rise in the average realized gold price.
Operating cash flow of $604.0 million and adjusted operating cash flow of $478.1 million. Attributable free cash flow of $345.9 million.
Reported net earnings of $210.9 million, or $0.17 per share, with adjusted net earnings of $174.7 million, or $0.14 per share.
Balance sheet strength: Kinross has improved its debt metrics, with term loan repayments of $200.0 million. Total liquidity is approximately $2.1 billion, including cash and cash equivalents of $480.0 million.
Kinross’ Board of Directors declared a quarterly dividend of $0.03 per common share payable on September 6, 2024, to shareholders of record at the close of business on August 22, 2024.
These are some great numbers and it seems the market is behind but responding to actual results with the higher gold prices. Key here is the margin increased to $1,313 per gold ounce sold.
Their Great Bear project is at 2.8 million ounces and growing with an exploration decline starting in 2026 with underground drilling. These types of deposits often have increased grade at depth, for example hole BR-843AC1A hit 389.57 g/t gold over 4.4 metres that is 700 metres down plunge.
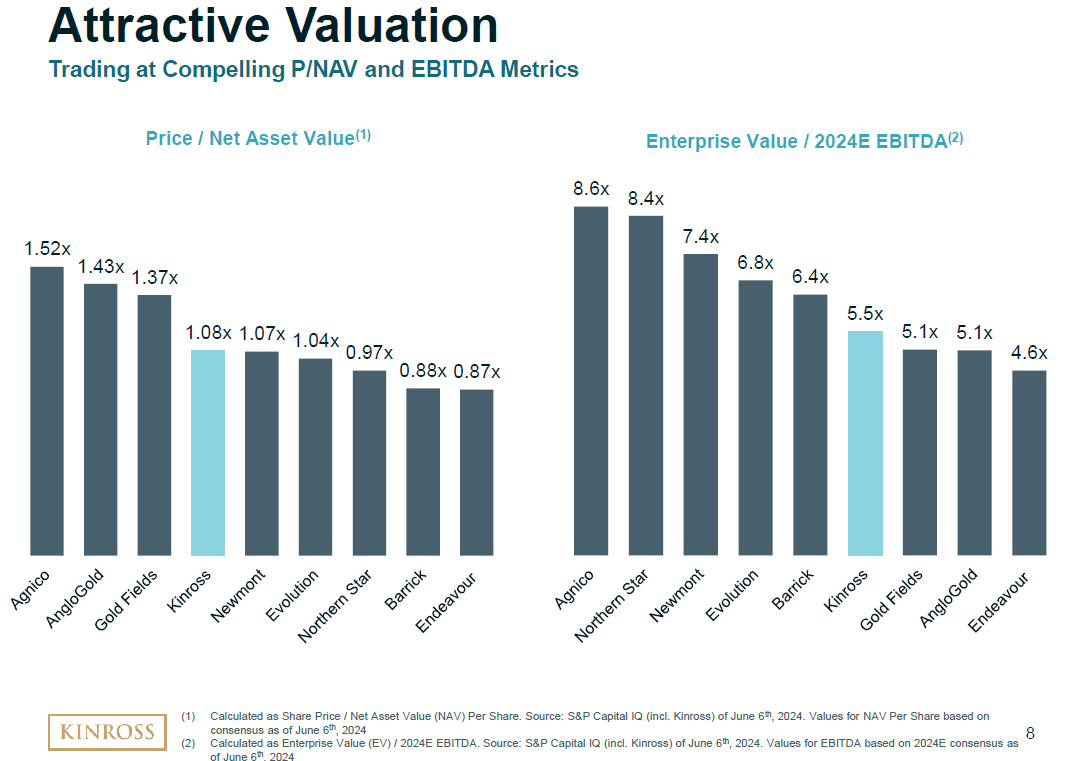
As per this slide from their presentation, the stock still remains at an attractive valuation compared to peers and has long term growth potential with the Great Bear Project.
The 2020 highs were about $13.50 and I expect the stock will test this level soon and break above it.
Paid Advertisers at playstocks
All forecasts and recommendations are based on opinion. Markets change direction with consensus beliefs, which may change at any time and without notice. The author/publisher of this publication has taken every precaution to provide the most accurate information possible. The information & data were obtained from sources believed to be reliable, but because the information & data source are beyond the author's control, no representation or guarantee is made that it is complete or accurate. The reader accepts information on the condition that errors or omissions shall not be made the basis for any claim, demand or cause for action. Because of the ever-changing nature of information & statistics the author/publisher strongly encourages the reader to communicate directly with the company and/or with their personal investment adviser to obtain up to date information. Past results are not necessarily indicative of future results. Any statements non-factual in nature constitute only current opinions, which are subject to change. The author/publisher may or may not have a position in the securities and/or options relating thereto, & may make purchases and/or sales of these securities relating thereto from time to time in the open market or otherwise. Neither the information, nor opinions expressed, shall be construed as a solicitation to buy or sell any stock, futures or options contract mentioned herein. The author/publisher of this letter is not a qualified financial adviser & is not acting as such in this publication.

