I will be away for a weeks holiday. In late July I said I was writing my 2nd Great Bear Trap article. Markets have kept falling since that time so I thought I better get this call our pronto. But first the 2001 recap.
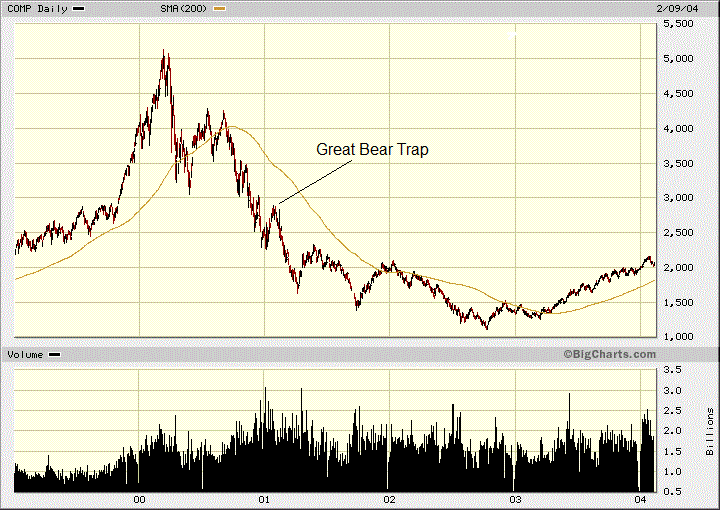
In February 2001, I wrote an article called the 'Great Bear Trap'. The dotcom bubble popped in 2000 and by the end of the year, the NASDAQ market declined a whopping -55%. It then rallied about +26% in early 2001, peaking around 2850 around the end of January. Everyone, all the main stream analysts, wall street etc. were calling it the end of the bear market. After all it met the official status of a new bull market, up over +20%. However, those gains and more were given up within a month and the market made it's actual bear market low in 2002. It crashed another -60% from the Bear Trap.
Of course conditions are much different now. If you remember that the narrative on inflation was 'it is transitory' and I called that hogwash. When that was realized by markets, interest rates had to go up and the markets started their 2022 bear market. The 2023 rally has been driven by the narrative that OK, interest rates are going up, but that will bring down inflation and interest rates will come back down. As you know, I have been commenting that inflation will become entrenched and it will actually go back up. We just saw the first little hint.
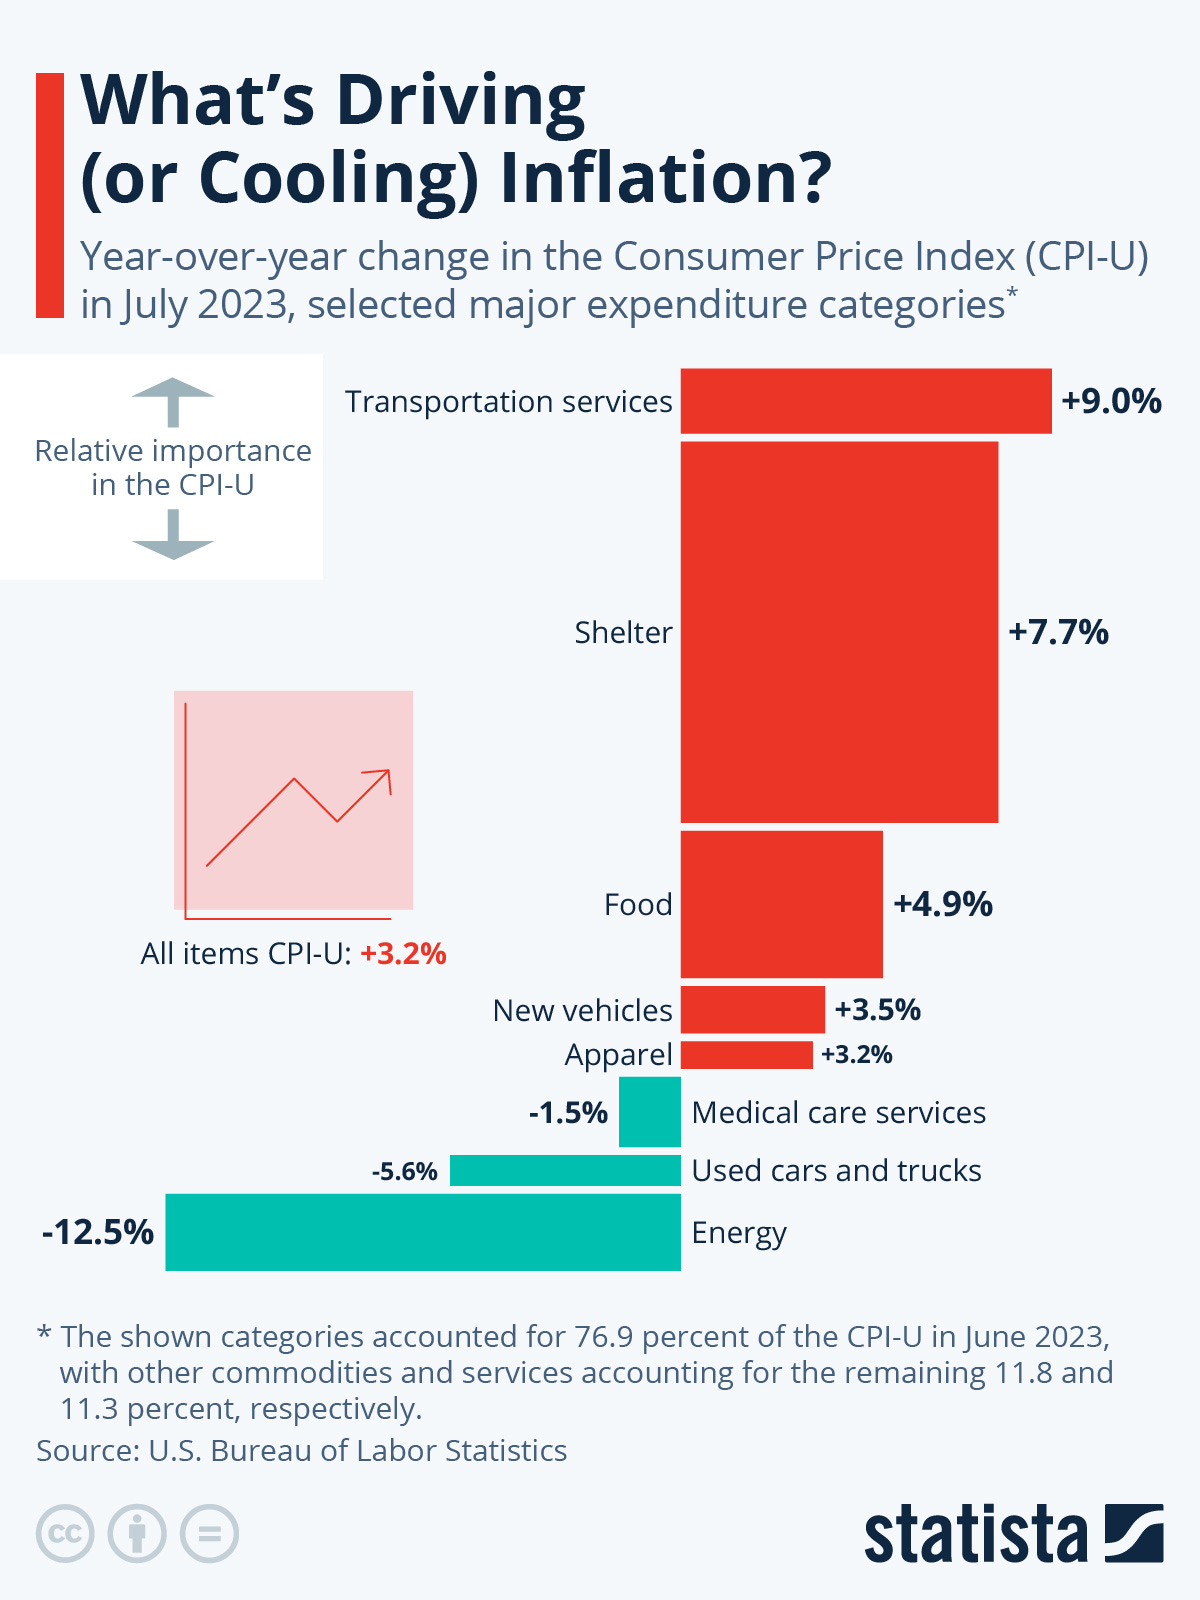
Inflation in the United States ticked up slightly in July, as the 12-month increase in the Consumer Price Index for All Urban Consumers (CPI-U) accelerated to 3.2 percent. In Canada the up tic with inflation was a bit larger, from 2.8% to 3.3%.
In Canada food inflation was up +8.5% when we normally see a decrease with local produce in the summer. Gas prices also added to inflation with the carbon tax. You will also know that I have been predicting US inflation to go higher in August and September. As you can see in the chart, energy is still pulling overall inflation down, but that will end in the coming months.
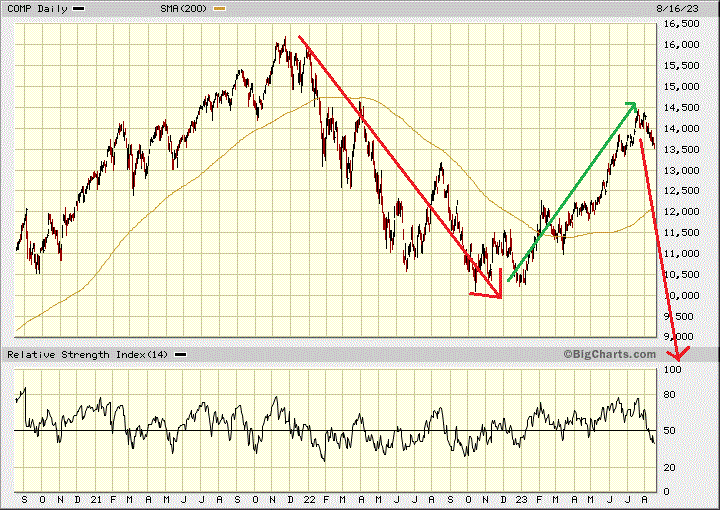
This chart is the Nasdaq Composite since most of the 2023 rally has been driven by 7 tech stocks. We have just over a +40% rally from the late 2022 bottom, so I think I will call this the magnificent seven short bull market and Great Bear Trap. The S&P 500 rallied about +30% again mostly from the same 7 stocks.
As the market realizes that inflation is sticky and not coming down, equity markets will correct much further. Not as steep or quick as my red arrow indicates, it is like that because that is all the room on the chart. And what is more, interest rates are not coming down but will go higher. Until just recently, the bond market has been forgiving and holding longer term rates down, also believing in the short term inflation narrative.
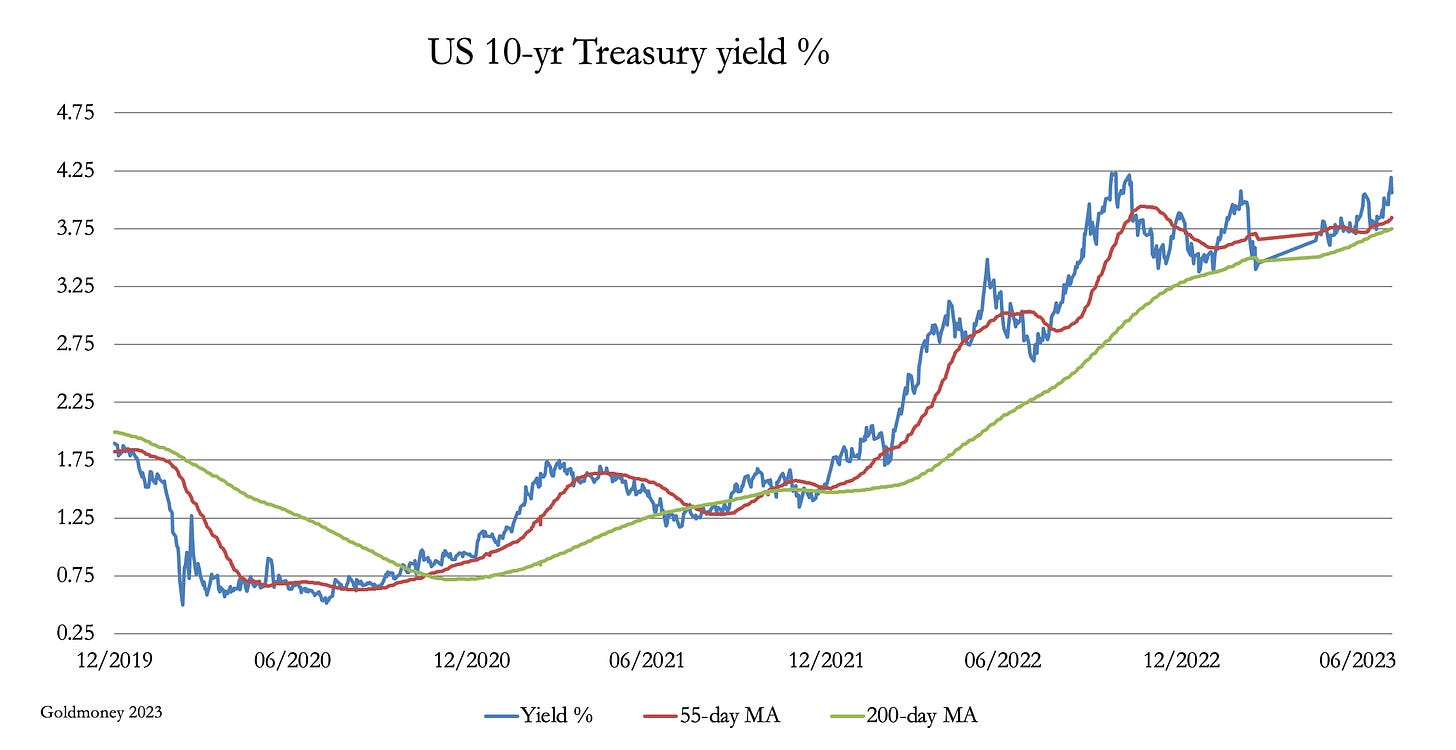
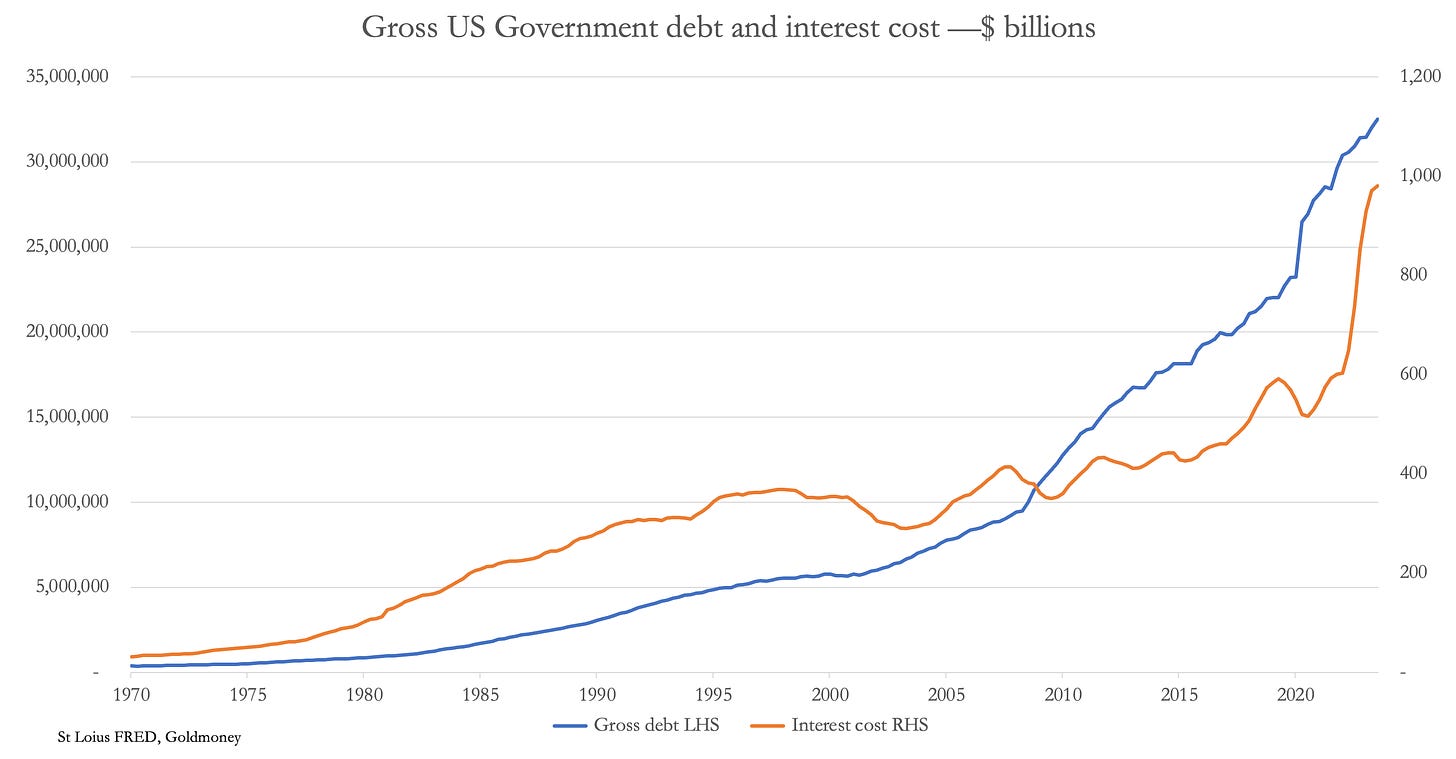
As you can see the 10 year treasury yield is back to last years highs. The yield closed at 4.25% on Wednesday - marking the highest level since 2008. The bond market is starting to lose confidence in the Fed and US government ravaging debt load. Below, since 2008 US Government debt is growing exponentially. More alarmingly, the interest cost is soaring. It will not be long and the interest costs will be $2 trillion. Runaway funding requirements and interest costs make up the classic debt trap, leading to a collapse in confidence in debt/bonds and a fiat currency. This is much like the 1970s, the last period we had of rising inflation and interest rates.
Now many will just recall recent times and figure, well the Fed can just print more money and have more QE. They could and may have to, but this is what is causing the current problem and will just make it worse. With this erosion in confidence there will be a flight out of fiat currencies and into gold, like the 1970s. This is probably why central banks have been buying gold in record amounts because they know this day is coming. You see, stock markets are small potatoes compared to the bond market. If confidence is falling in bonds, investors are saying they don't like your debt and your currency.
Covid-19 was a great excuse to print massive amounts of money and the authorities might try to come up with another distraction or excuse. An economic collapse could be it and that is on the horizon with rates increasing. Again like the 1970s, a period of high inflation and in and out of recessions. Gold will also do well in this environment.
Another possibility or excuse for QE is an escalation of the Russia war or even a war with China. I hope this is not the outcome, but it would also send gold way higher.
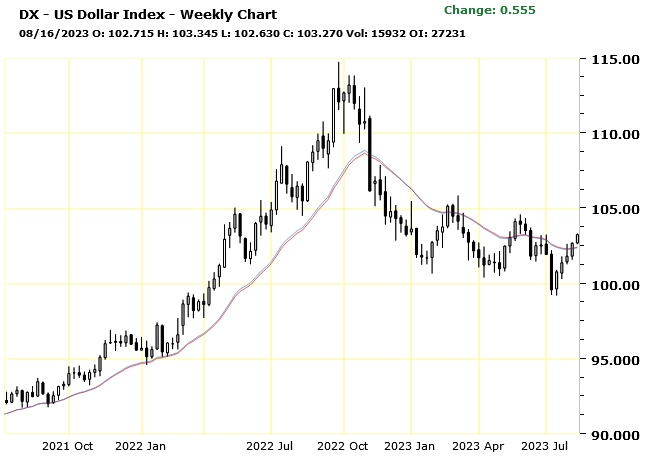
I believe during the next few years we will see a parabolic move in the gold price like we see in the debt chart above. I expect this next move up in gold will take it into the US$4,000 to $6,000 range. Another hint at a loss of confidence was a drop to new lows in the US$ index in July, shown below. Granted, a lot of the currencies the index is compared to are rowing the same boat, so in the end it will be the drop in the $ priced in gold. In other words, a much higher gold price.
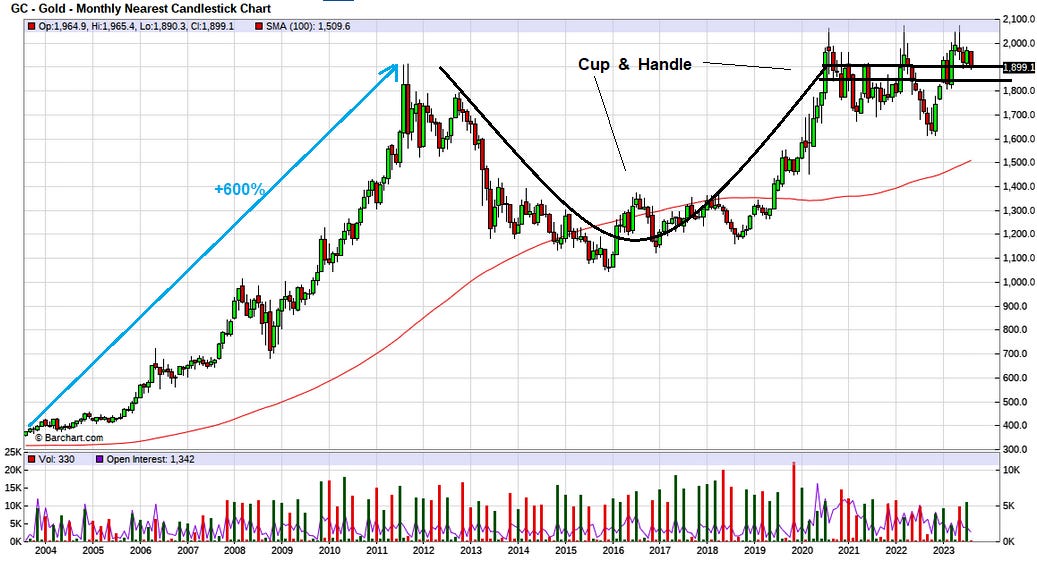
As investors we just need to be patient and hold tight. It will mean little now if gold moves 10% or 15% up or down. It will be the 100% up moves where we will make a killing, like the 1970/80s and 2000s. Lets look at the long term chart in gold.
In the 1970s, gold ran up around 1,500%. The 2000s bull run came from a bottom of $250, but using $300 it moved up over +600%. The current period we are in is more like the 1970s so a 1,000% increase in gold would not surprise me. I also highlight the cup and handle formation that usually has longer term bullish implications.
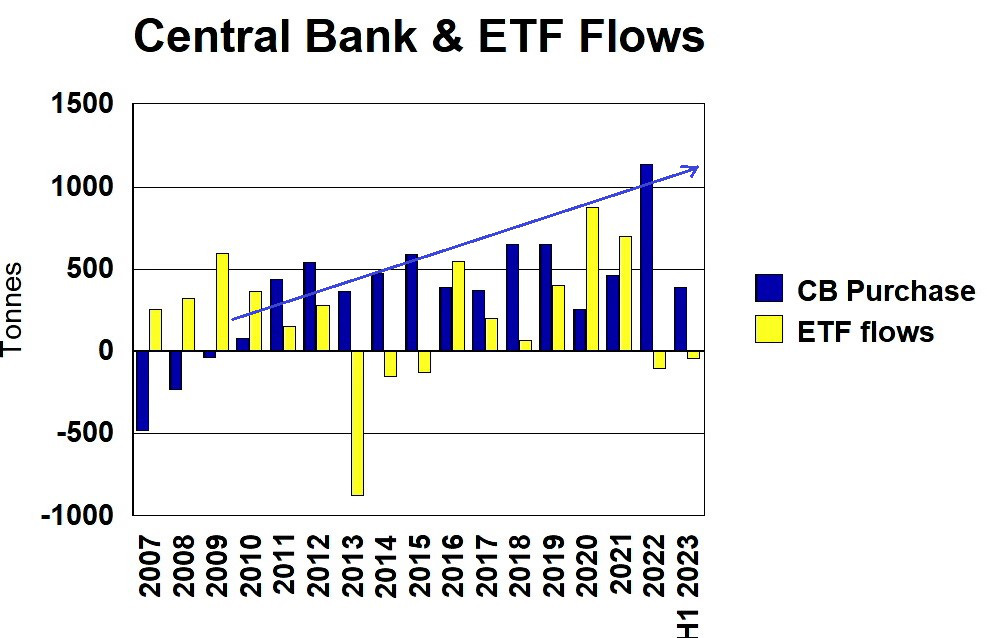
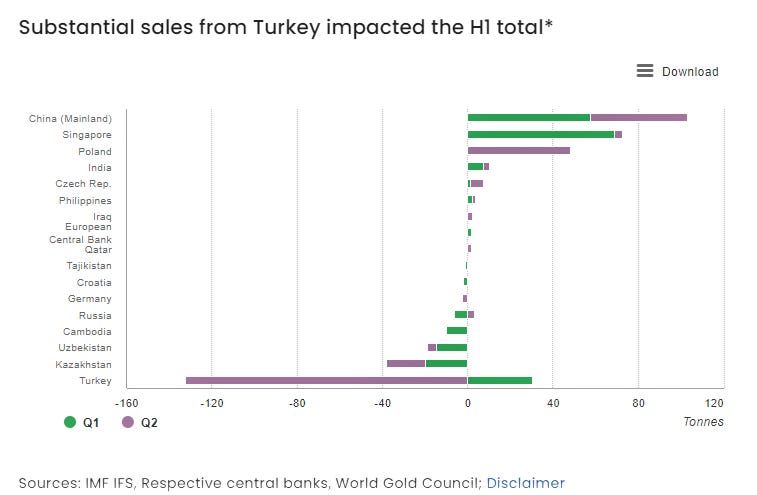
Central Banks know the run to gold is coming. Their buying in the 1st half of 2023 was a record at 387 tonnes in spite of Turkey selling 102 tonnes and six others selling 72 tonnes. This record 1st half followed a record year of buying in 2022. Also of note, retail investors and funds have been sellers of ETFs in the last 2 years.
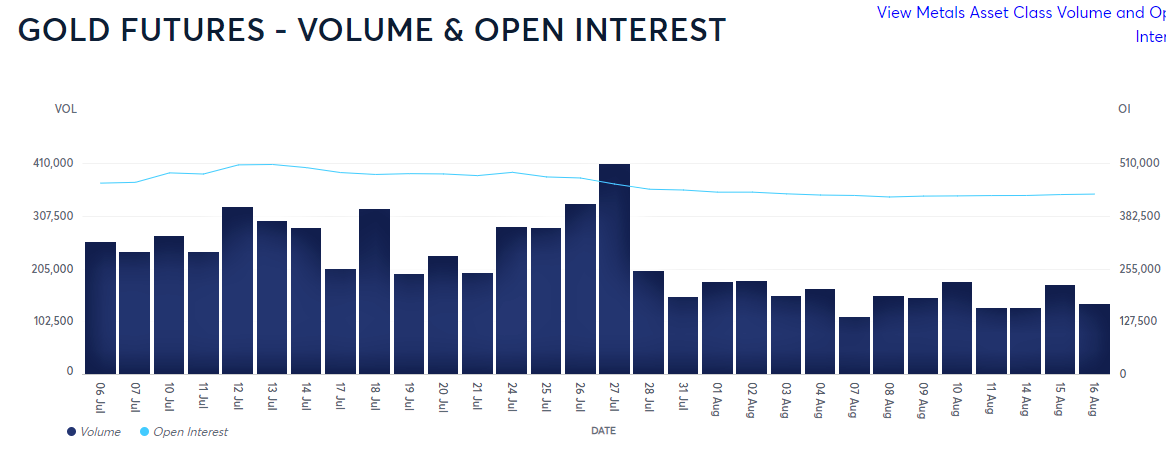
Volume and Open interest in gold futures has fallen off in August to levels, I don't think I have seen for years. Declining open interest means a decline in buying. This is another good indicator that the gold market is bottoming out here.
Conclusion
Simply put, this crappy market will end and bottom out. We just need to be patient as everything is pointing to a big rotation in markets. This I expect, we will see rising energy prices, food and grain prices then commodities in general as confidence in the highly debited fiat currencies erodes. This will also send precious metals on their next bull market. And it is going to be a biggy.
Midnight Sun - - - - TSXV:MMA - - - - - OTC:MDNGF - - - - Recent Price - $0.26
Entry Price - $0.27 - - - - - - - - - Opinion - buy
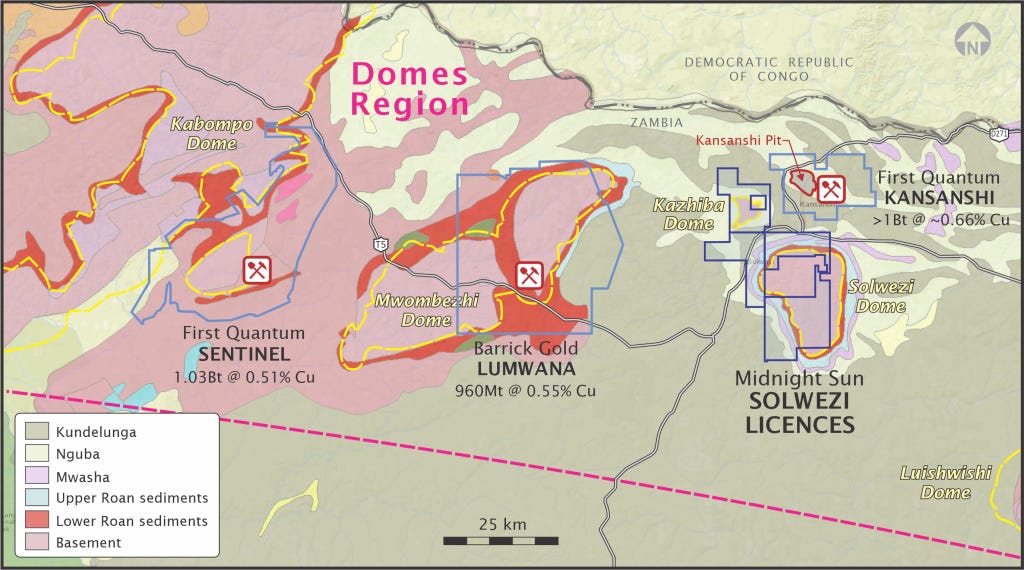
It has been a while since I updated MMA. They had some drill results in late July and I have learned a strong investment group has started to come into the stock. The stock has been trading sideways for quite a while and I am expecting a good move up after the summer. As a reminder, Midnight Sun is focused on exploring their Solwezi project, located in Zambia. Situated in the heart of the Zambian copper belt, the second-largest copper producing region in the world, its property is vast and highly prospective. The company's Solwezi project is surrounded by world-class producing copper mines, including Africa's largest copper mining complex right next door, First Quantum's Kansanshi mine is about 7 km away with about 1 billion tons of 0.66% copper.
The project is large at around 506 sq kms with four main target areas. Just to the north, across the border in the same belt in The Congo is Ivanho Mines Kamoa-Kakula project that is on track to become the worlds 2nd largest copper producer with grades at almost 3% copper. MMA is in elephant country with location, location, location. Zambia is a great mining country with 3/4 of their exports coming from mining metals.
MMA has had the project for about 12 years and acquired it when copper prices were low and it was hard to raise investment money. They have had much the same timing as Zonte Metals another one of our copper plays. MMA has managed to keep a good share structure over this time. I have known CEO Al Fabro for many years going back before Midnight Sun time with Roxgold that is now an operating gold mine. I have now met their VP of Corporate Development Matt MacKenzie a number of times now and have also known one of their other directors Rick Mazur for many years. They have done a lot of work over the years and have isolated the 4 best targets .
These are Sedex targets and they are Dumbware , Mitu, Kazhiba (22 Zone) and Crunch Zone. Dumbwa is probably the best target at this time and MMA hopes to attract a major partner on this one. It features a remarkable copper soil anomaly, which ranks among the strongest on record in Zambia. This continuous, high-grade, copper-in-soil anomaly tracks for over 20 kilometres along strike and exceeds 1 kilometre in width, with peak values up to 0.78% copper.
Kazhiba is another excellent target. The discovery hole intersected 11.3 metres of 5.71% Copper, near surface. Additional intercepts include 21 metres of 3.26% Copper and 6.4 metres of 5.08% Copper. Drill campaigns in 2013 (reverse circulation) and 2014 (diamond drilling) extended the high grade, near surface discovery. Drilling has now confirmed a high-grade copper oxide blanket, the source of which is yet to be found.
July 25th, MMA released a summary of results from the 2022 drilling campaign on the Mitu prospect. Initial laboratory results were received shortly after the conclusion of drilling in 2022, however the company chose to reassay select drill core in order to confirm laboratory accuracy. SGS Inspection Services Kalulushi, has now completed all assays. Copper mineralization intercepted at Mitu is associated with cobalt, nickel and anomalous gold. This suite of metals is comparable in mineralization style and grade with those at First Quantum's Sentinel mine, located approximately 120 kilometres west of Midnight Sun's Solwezi project.
2022 Mitu drill highlights include:
MTDD044: 11.50 metres at 1.41 per cent copper, 0.11 per cent cobalt and 0.03 per cent nickel:
Including 4.15 m at 1.29 per cent copper, 0.13 per cent cobalt and 0.09 per cent nickel;
Including 5.80 m at 1.86 per cent copper, 0.07 per cent cobalt and 0.02 per cent nickel.
MTDD045: 7.30 m at 0.58 per cent copper, 0.02 per cent cobalt and 0.02 per cent nickel;
MTDD047: 26.10 m at 0.32 per cent copper, 0.07 per cent cobalt and 0.05 per cent nickel;
MTDD048: 22.25 m at 0.39 per cent copper, 0.01 per cent cobalt and 0.01 per cent nickel.
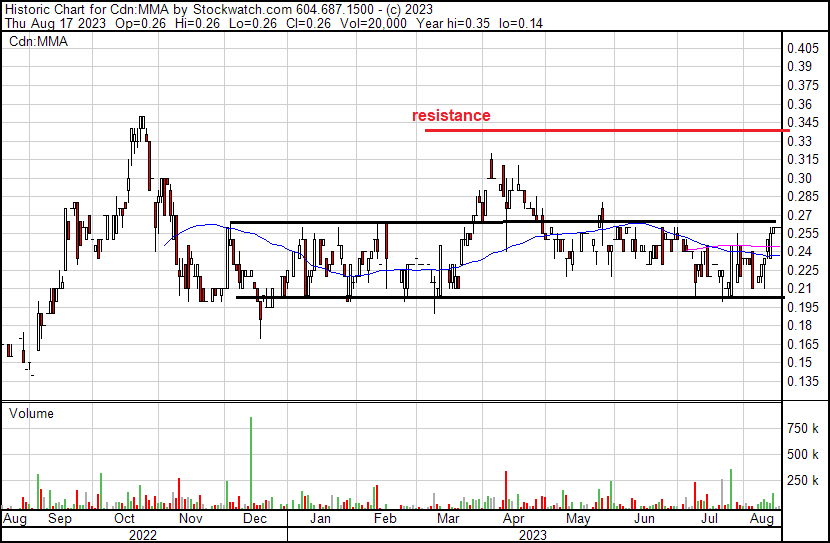
Some very good initial results. Midnight Sun has been at this long time, but saying that, timing is everything and I believe their time is coming soon. The stock has been stuck in a trading range, mostly between $0.20 and $0.26 since last November. A break above $0.27 would be very positive and ultimately above resistance around $0.34. You might try bids below market and/or buy on the break out.
All forecasts and recommendations are based on opinion. Markets change direction with consensus beliefs, which may change at any time and without notice. The author/publisher of this publication has taken every precaution to provide the most accurate information possible. The information & data were obtained from sources believed to be reliable, but because the information & data source are beyond the author's control, no representation or guarantee is made that it is complete or accurate. The reader accepts information on the condition that errors or omissions shall not be made the basis for any claim, demand or cause for action. Because of the ever-changing nature of information & statistics the author/publisher strongly encourages the reader to communicate directly with the company and/or with their personal investment adviser to obtain up to date information. Past results are not necessarily indicative of future results. Any statements non-factual in nature constitute only current opinions, which are subject to change. The author/publisher may or may not have a position in the securities and/or options relating thereto, & may make purchases and/or sales of these securities relating thereto from time to time in the open market or otherwise. Neither the information, nor opinions expressed, shall be construed as a solicitation to buy or sell any stock, futures or options contract mentioned herein. The author/publisher of this letter is not a qualified financial adviser & is not acting as such in this publication


