Jobs, Retail Store Stocks being Slaughtered, Trillion TCF
Welcome and thank you to all the new, smart, savvy and contrarian investors to my substack. If you like outside the box thinking, a humble analyst that has spent his career studying market and economic cycles, picked numerous tops and bottoms, someone not afraid of controversial topics and can be a bull and a bear, your at the right place. Please share and subscribe.
Mixed economic news today with fewer job openings, a growing trade deficit, but good factory orders. However Retail Stores are screaming recession or better put, stagflation.
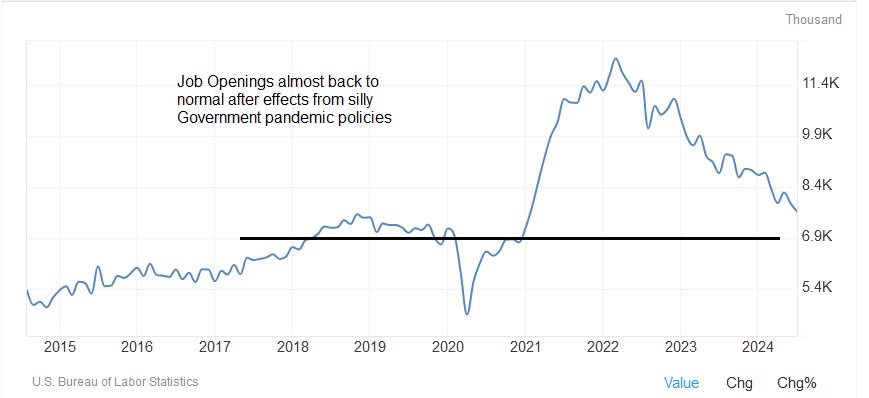
America's employers posted fewer job openings in July than they had the previous month, a sign that hiring could cool in the coming months.
The Labor Department reported Wednesday that there were 7.7 million open jobs in July, down from 7.9 million in June and the fewest since January 2021. Openings have fallen steadily this year, from nearly 8.8 million in January. Layoffs also rose to 1.76 million, the most since March 2023.
The US trade deficit widened to a two-year high in July, fueled by a surge in imports of goods. The goods and services trade gap grew 7.9% from the prior month to $78.8 billion, Commerce Department data showed Wednesday.
The July shortfall suggests trade will again weigh on gross domestic product after subtracting the most since the start of 2022 in the second quarter. A pickup in merchandise imports shows the scramble by US companies to stock up ahead of a possible work stoppage by East and Gulf Coast dockworkers at the end of this month.
For the good economic news, US factory orders jumped 5% in July, compared to the previous month, rising for the first time after two consecutive monthly decreases. New orders for manufactured goods, which measure the change in the value of new purchase orders placed with manufacturers, increased $28.2 billion to $592.1 billion.
New orders for manufactured durable goods in July, meanwhile, rose $25.9 billion, or 9.8%, to reach $289.5 billion -- up five of the last six months.
There is no doubt the economy is in very bad shape when retail stocks like these ones are being slaughtered. There is something very wrong with the economy hiding behind the government reported data.
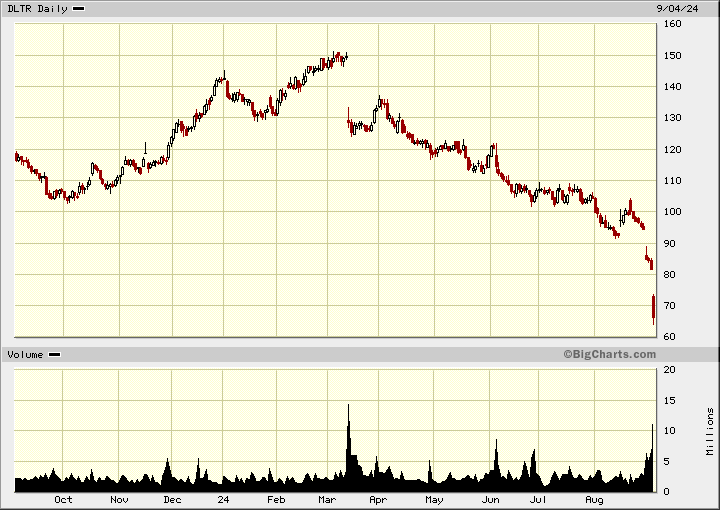
Dollar Tree Inc. (DLTR): $65.90 – near 10 year lows
Dollar Tree's low-cost model is increasingly strained by rising input costs and supply chain disruptions. The company’s fixed price point strategy limits its flexibility to adjust prices in response to inflation. Additionally, competition from other discount retailers and online giants is intensifying, potentially eroding Dollar Tree's market share. The recent slowdown in consumer spending, particularly on discretionary items, further pressures its revenue growth. With higher operational costs and diminishing margins, DLTR faces a challenging road ahead.
Dollar Tree joined main rival Dollar General in cutting annual forecasts after missing quarterly estimates today as the discount store operator struggles to attract price-sensitive shoppers amid rising competition. The stock has dropped about $30 in the last few days.
Dollar General (DG): $82.15, -70% from highs, now at 2017 levels
Despite its extensive footprint, Dollar General is not immune to the pressures impacting the discount retail sector. The company faces rising wage costs and supply chain challenges that could squeeze its profitability. Additionally, its growth strategy heavily relies on rapid store expansion, which may strain financial resources and dilute returns. Increasing competition from both traditional and e-commerce competitors could hinder its market position, making it harder to sustain its historical growth rates.
Dollar Tree's stock was tumbling 19.3% in recent trading after the discount retailer reported the biggest quarterly profit miss in at least five years, according to available FactSet data. The stock was by far the biggest loser among S&P 500 components and the selloff is certainly historic.
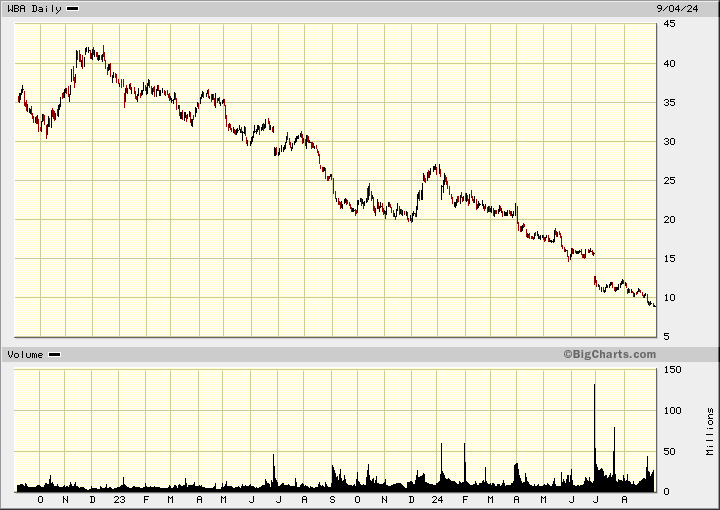
Walgreens Boots Alliance Inc. (WBA): $8.90, 25 year lows
Walgreens is struggling with declining same-store sales and shrinking profit margins amid a tough retail environment. The company's heavy dependence on the pharmacy business is a vulnerability, particularly with the rise of telehealth services and increased competition from online pharmacies. Moreover, its global expansion strategy has not yet proven to be as successful as anticipated, adding further strain. Operational inefficiencies and a shifting healthcare landscape present significant risks to WBA's profitability and long-term growth prospects.
In a report released today, Allen Lutz from Bank of America Securities reiterated a Sell rating on Walgreens Boots Alliance (WBA – Research Report), with a price target of $7.50. Allen Lutz has given his Sell rating due to a combination of factors affecting the financial health and prospects of Walgreens Boots Alliance. The company is expected to face continued pressure on its gross profit and margins well into FY25.
Some good news with one of our junior oil&gas stocks
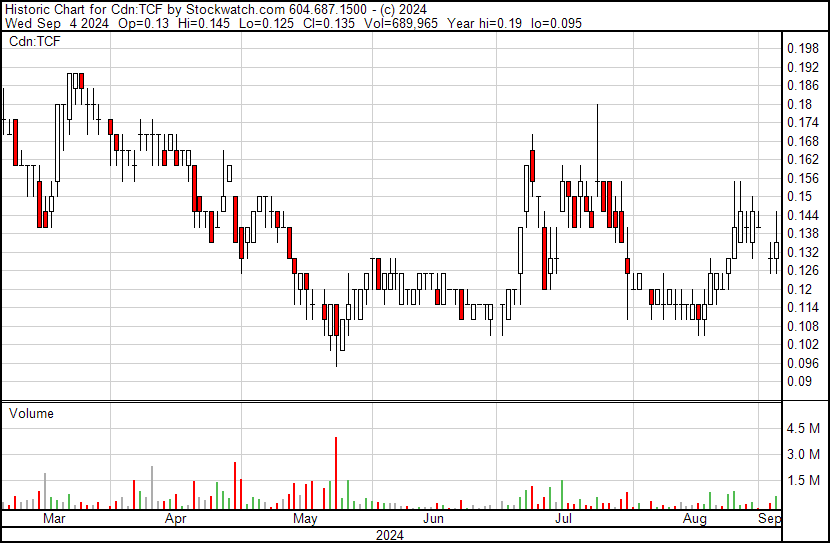
Trillion Energy CSE: TCF, OTCQB: TRLEF - - - Recent Price - $0.14
Entry Price - $0.19 - - - - - - Opinion - buy
Today, TCF announced a production update for oil and gas fields, highlighting robust performance and strategic developments. The stock has moved up some.
During the month of August, the 100% gas production from SASB was about 133.13 MMcf giving a gross total of US$1,456,400 and a Trillion 49% value of US$713,640 with a realized Natural Gas price of about US$10.94. Trillion’s gross oil revenue from Cendere is US$342,700. Trillion’s total gross production revenue for August is US$1,056,340.
The gas revenue from SASB is 95% from Guluc-2 and South Akcakoca-2, both stabilized and 5% from West Akcakoca-1 which has not stabilized and produces intermittently. SASB’s total average production for August was 4.6 MMcf/d. Akcakoca-3 well head pressure (WHP) has continued to increase to a current 583 psi compared to the initial WHP of 100 psi and early this week the well will be opened for a flow test.
Trillion Energy is positioned to significantly enhance production through the installation of 2 3/8” velocity strings (VS), replacing the current 4 ½“tubing. To install the VS the wells have to be killed, but with the wells producing gas at these high daily rates killing the well is undesirable therefore the feasibility of installing the VS in a flowing well is being evaluated.
CEO Arthur Halleran stated: “Trillion’s August gross revenue of US$1.46 Million illustrates the future potential of increasing the monthly revenue once we have more than just two gas wells producing. The VS (2 3/8” production tubing) installation in all 6 wells will substantially increase the gas production at SASB. The 10 legacy wells at SASB between 2007 and 2021 produced a total of 42.19 Bcf of gas utilizing 2 3/8” production tubing, about 4.2 Bcf/well. We can expect the same with our wells once we put in the 2 3/8”. Even with the 4 ½” production tubing we have produced 2.71 Bcf of gas from our 2022/23 wells. Our gas price is US$10.94/mcf whereas the Henry Hub Gas spot price is US$1.91.”
Trillion's well work over is generating good results. Cash flow will fund their oil exploration on huge targets, late this year or early next. We need to see the stock close at $0.17 or higher for a higher high on the chart.
Paid Advertisers at playstocks
All forecasts and recommendations are based on opinion. Markets change direction with consensus beliefs, which may change at any time and without notice. The author/publisher of this publication has taken every precaution to provide the most accurate information possible. The information & data were obtained from sources believed to be reliable, but because the information & data source are beyond the author's control, no representation or guarantee is made that it is complete or accurate. The reader accepts information on the condition that errors or omissions shall not be made the basis for any claim, demand or cause for action. Because of the ever-changing nature of information & statistics the author/publisher strongly encourages the reader to communicate directly with the company and/or with their personal investment adviser to obtain up to date information. Past results are not necessarily indicative of future results. Any statements non-factual in nature constitute only current opinions, which are subject to change. The author/publisher may or may not have a position in the securities and/or options relating thereto, & may make purchases and/or sales of these securities relating thereto from time to time in the open market or otherwise. Neither the information, nor opinions expressed, shall be construed as a solicitation to buy or sell any stock, futures or options contract mentioned herein. The author/publisher of this letter is not a qualified financial adviser & is not acting as such in this publication.


