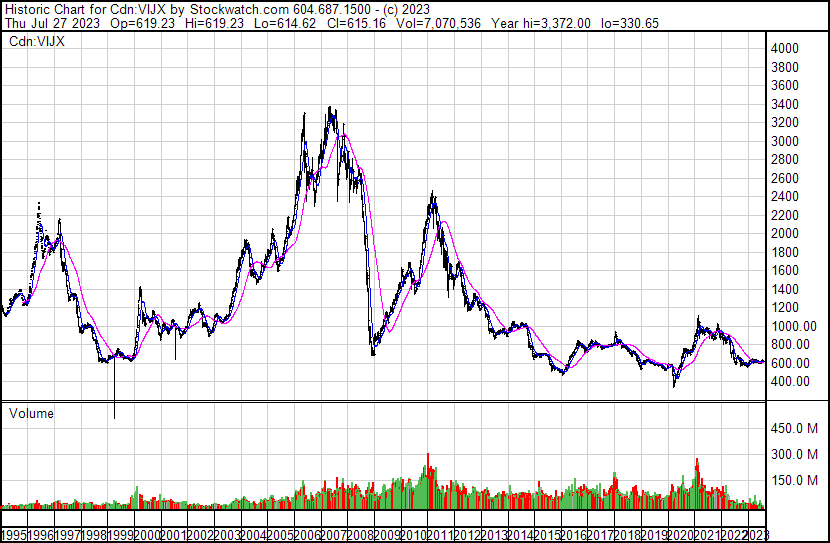
I got a handful of emails on Zonte dropping to new lows yesterday, so thought would just send out a short update. In a nutshell the junior market is still sucking big time and very little is bucking the trend. The chart below on the TSX Venture market, the best barometer for juniors continues sideways at very very depressed levels.
I went with a long term chart to show we are at the same level of the historic 1998/99 bottom when gold dropped to around $250. The index is also below the historic 2008 crash. Only the 2000 covid panic sell off was a bit lower but that was only short lived. We have been hanging out here around the 600 level for about 1 year so it is looking similar to the historic 1998/99 bottom.
What makes this market far worse than past bear market lows is the volume has dropped to levels that have never happened in history. It does not show well on this long term chart, but for the past year, volume has been a mere 20 million shares per day and probably half of that are computer trades. The 1998/99 bottom saw volume around 30 million per day with no computer trading.
Heck, there are 100s of different stocks that trade over 20 million shares per day and the TSXV has over 1,500 listed stocks and most days cannot add up to 20 million.
Beyond a doubt, this is the worst market in history and the TSXV takes the award of the worst market in the world.
As bad as it is, it is also a historic buying opportunity. The juniors will not stay depressed for very much longer. I expect there will be significant market change and rotation starting this fall.
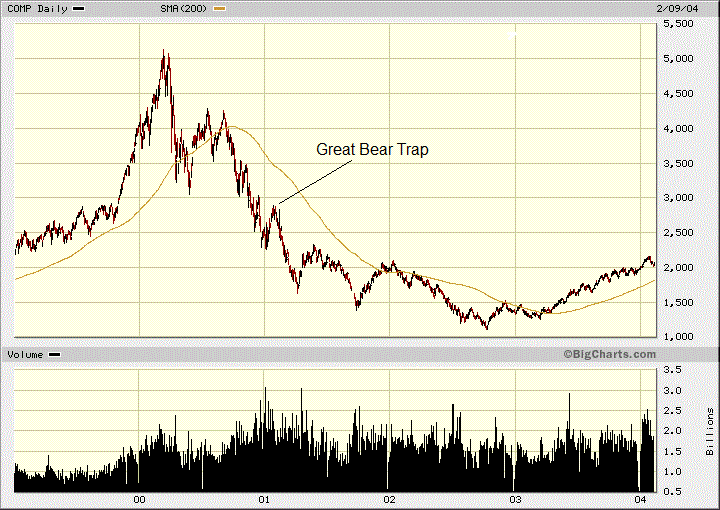
In February 2001, I wrote an article called the 'Great Bear Trap'. The dotcom bubble popped in 2000 and by the end of the year, the NASDAQ market declined a whopping -55%. It then rallied about +26% in early 2001, peaking around 2850 around the end of January. Everyone, all the main stream analysts, wall street etc. were calling it the end of the bear market. After all it met the official status of a new bull market, up over +20%. However, those gains and more were given up within a month and the market made it's actual bear market low in 2002. It crashed another -60% from the Bear Trap.
I mention this because I see a very similar thing that is going to happen with today's market. I am starting to write my 2nd 'Great Bear Trap' article 22 years later. See details soon.
Zonte Metals - - - - TSXV:ZON - - - - - - Current Price - $0.06
Entry Price $0.12 - - - - - - - Opinion – buy, average down
Nothing has changed with Zonte and I am expecting very, very good news this year, but In this market, there is no sense chasing. I think there is still more time before we rally. I would try bids at 5 or 6 cents and see if sellers come to you.
Also note that the TSXV had it's strongest rally after the 1998/99 bottom, soaring almost 5000% to the 2007 top. I believe we are setting up for a similar repeat.
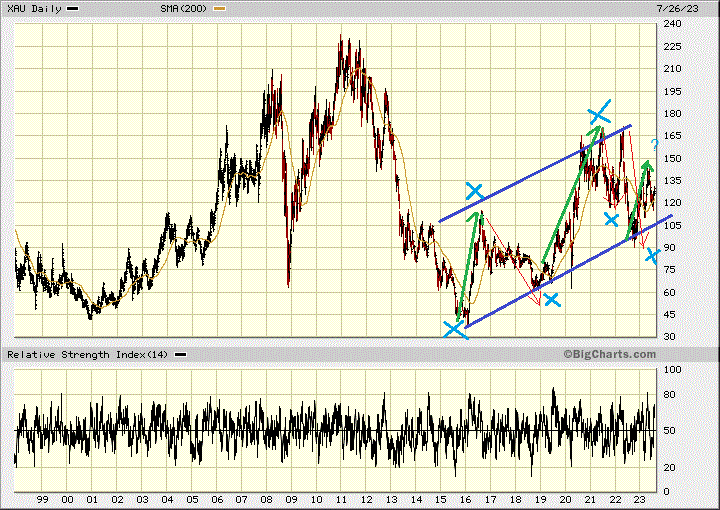
It is also important to note that the precious metal producers have been performing far different than the junior explorers. I used a chart of the gold and silver index. XAU because it has been around forever, longer than the HUI and I wanted to show back to the late 90s/2000 bottom. It was ridiculous that the early 2016 bottom was lower than the 1999/2000 bottom. Gold dropped to around $1100 end of 2015 which was 4 to 5 times higher than the $250 bottom in 1999/2000 bottom.
I used the standard 20% plus gains and losses to define bull moves and bear moves shown in green and this red lines respectively. Since the early 2016 bottom, the precious metal producers have been very volatile going up and down. We have witnessed this by being stopped out and buying back our gold stocks a number of times over this period. We make some small gains each time, but nothing big. The best observation is we are in a long uptrend of higher highs and higher lows, shown by the purple lines. However, in general the stocks have been way underperforming gold. Since 2020 gold has been fluctuating from around the $1,700 are to record prices over $2,000. Gold stocks should have approached their 2011 highs when gold peaked at $1,900. The good news is we are in another bull move and if the higher high pattern holds we should get to 180 or higher on the index. Maybe this is the start of the over due big bull move.
OIL
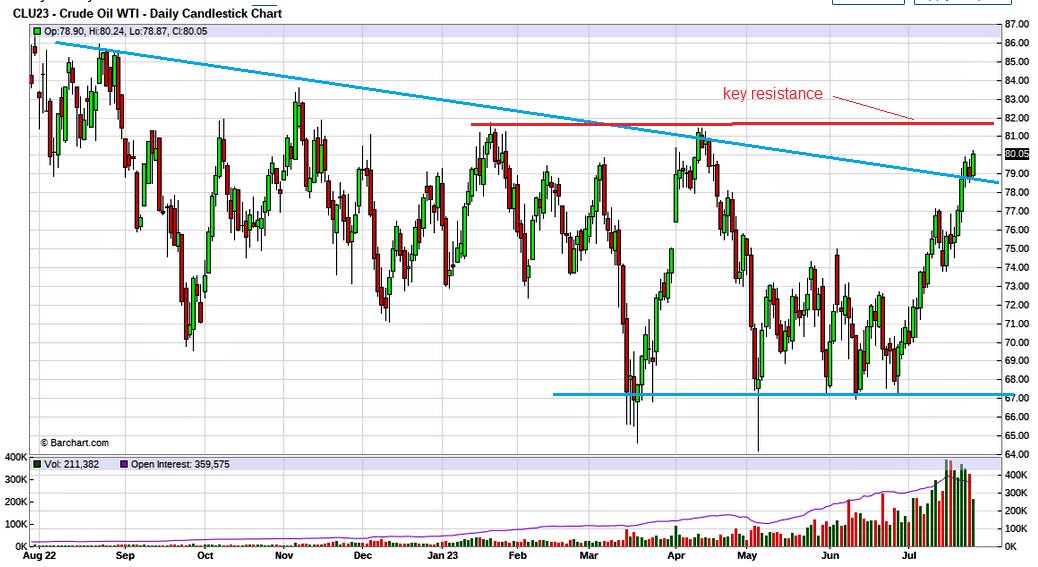
As you know, I am bullish on oil and gas and believe the energy transition to electric will end in disaster and shortages of electricity and fossil fuels. Oil is showing the first signs of a market rotation that I see coming this fall. Maybe oil starts before then? This is the September Comex crude chart and we have broken the down trend and to the upside on a wedge pattern (blue lines).
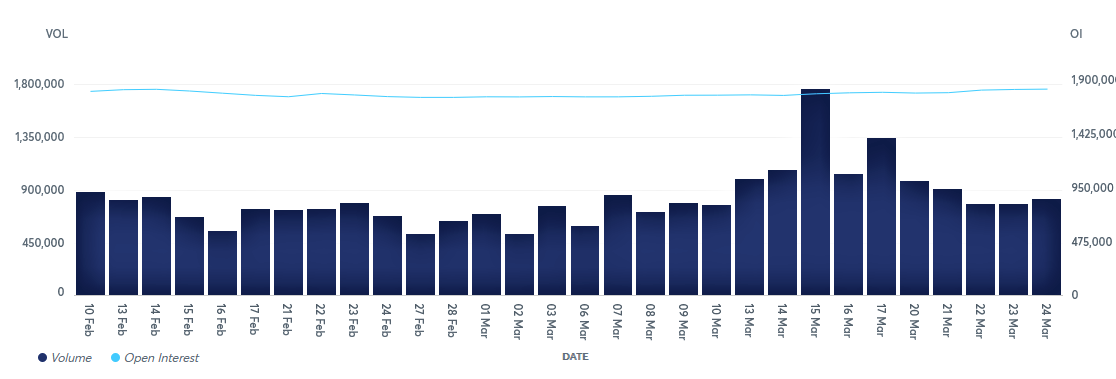
I see important resistance around $82 and a solid close above $82 would be a higher high and very bullish. I expect we will not break this on the current run. I checked open interest on Crude Oil and it is not going up, so this rally is probably mostly driven by short covering. Rising open interest would indicate new buying and that is not here yet. Perhaps that comes in the fall, unless we have a hurricane hit the gulf oil area this hurricane season (August through October).
However the current open interest is higher than it was at the lows earlier in the year.
Oil Open Interest, all contracts to July 26
The chart below is an older one I previously used and shows lower open interest back in February and March 2023 when oil was bottoming out.
All forecasts and recommendations are based on opinion. Markets change direction with consensus beliefs, which may change at any time and without notice. The author/publisher of this publication has taken every precaution to provide the most accurate information possible. The information & data were obtained from sources believed to be reliable, but because the information & data source are beyond the author's control, no representation or guarantee is made that it is complete or accurate. The reader accepts information on the condition that errors or omissions shall not be made the basis for any claim, demand or cause for action. Because of the ever-changing nature of information & statistics the author/publisher strongly encourages the reader to communicate directly with the company and/or with their personal investment adviser to obtain up to date information. Past results are not necessarily indicative of future results. Any statements non-factual in nature constitute only current opinions, which are subject to change. The author/publisher may or may not have a position in the securities and/or options relating thereto, & may make purchases and/or sales of these securities relating thereto from time to time in the open market or otherwise. Neither the information, nor opinions expressed, shall be construed as a solicitation to buy or sell any stock, futures or options contract mentioned herein. The author/publisher of this letter is not a qualified financial adviser & is not acting as such in this publication


