My predictions for 2024 were that the best market would probably be in the first half of the year. Markets could make new highs but I doubt it will be much to write home about. We have already had most of the gains for 2024. It seems a couple of the biggest/brightest investors agree with me.
Warren Buffett, just thinned out his Apple shares by a substantial 13%. There is a cash mountain at Berkshire Hathaway, now tallying up to a record breaking $189 billion. Buffet is preparing to pounce on better deals when the market turns south.
Billionaire investor Stanley Druckenmiller, who told the hosts of CNBC’s “Squawk Box” lastTuesday morning that his firm had cut its stake in chip giant Nvidia Corp. “We did cut that and a lot of other positions in late March. I just need a break. We’ve had a hell of a run. A lot of what we recognized has become recognized by the marketplace now.” — Stanley Druckenmiller.
And Druckenmiller dropped another bomb shell -Bidenomics, If I was a professor, I’d give him an ‘F’. Basically, they misdiagnosed Covid and thought [the economy] was going into a depression... Treasury is still acting like we’re in a depression. They’ve spent and spent and spent, and my new fear now is that spending and the resulting interest rates on the debt that’s been created are going to crowd out some of the innovation that otherwise would have taken place.... Everybody seems to get it but Yellen, who just keeps spending and spending.
More and more in the market are realizing that stagflation has arrived and rates are not going down. Like I have said before 'higher for longer' will soon be 'higher forever'.
Do you remember the March FOMC meeting? The Fed released its projections for rate cuts in the coming months. The consensus was for three cuts this year according to the 'dot plot'. I have often said to ignore this as it really has little meaning, but the market grasps on to any hope of a rate cut. Fast forward six weeks and that’s all gone. Not six months but only 6 weeks. Did the underlying economic fundamentals really shift significantly in just six weeks?
And Powell comments that rates won't be increased, that is scary, why did he have to make this comment? Probably because the bond market was signalling increases. Remember, the Fed does not set interest rates, the market does. That said, the Fed does have big influence and some of that they do with 'Fed speak' and try to talk the market where they want.
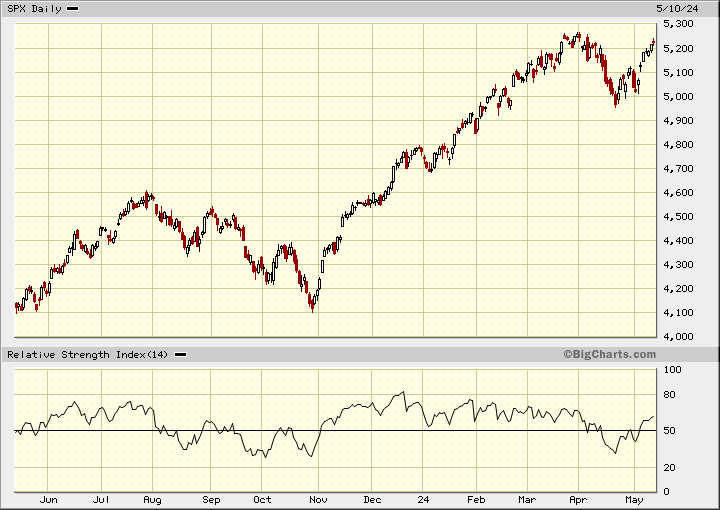
On the S&P 500 chart, it looks to be putting in a double top, but even if it goes to new highs, I doubt they will be that significant. Most of the risk from here is to the downside. It would be a good idea to switch equity funds into money market funds. I would not get to aggressive in the bond market yet as it could go down with further market driven rate increases. The U.S. Bond Market has now been in a drawdown for 44 months, by far the longest bond bear market in history.
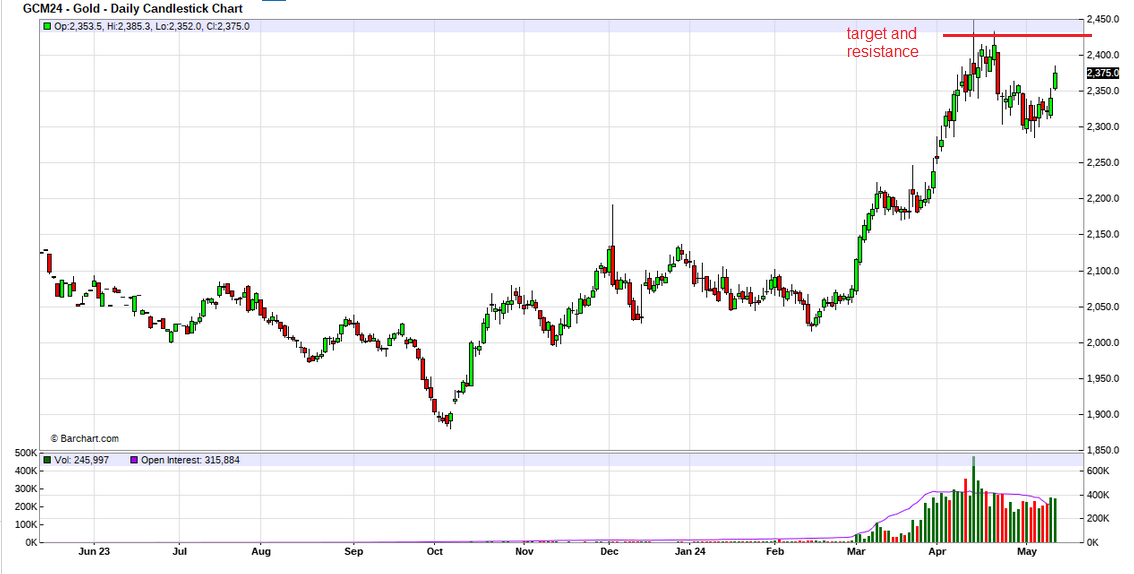
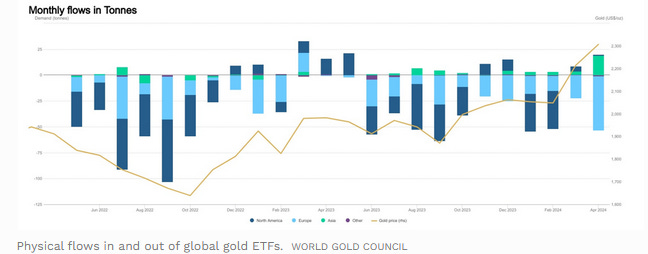
For gold, I would say the recent correction and consolidation has ended. I expect gold will now test recent highs and will not be long making new highs. It is still quite surprising the market has not caught on to this new gold bull market yet. Open Interest on Comex has hardly increased if any at all, basically flat and Comex long positions are still a long way from previous bull moves. ETFs are still showing outflows, bamboozling most investors.
Total holdings in bullion-backed ETFs slipped by 33 tonnes in April, the WGC said, to 3,080 tonnes. This was the lowest amount for more than four years.
Western Central Banks have been surprised by the eastern central bank physical buying, This flight out of the US$ is far more severe then the 1970s when the US had to abandon the gold standard.
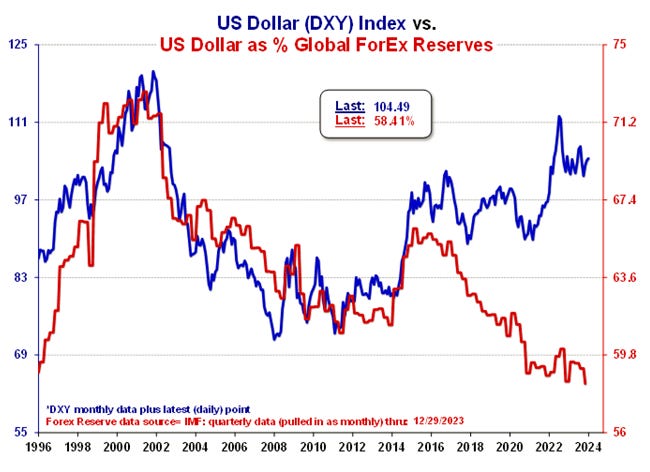
The Fed is the only remaining global central bank that has not complied with the new Basal III requirements so Comex gold is not reflecting the physical gold price that is being set by the rest of the worlds central banks. To keep the Comex market viable, they have to allow the electronic delivery of gold contracts into the physical markets like London. This is what is draining gold out of the Comex and the ETFs. It is very similar to the gold window that Nixon was forced to close in the 1970s. Basically US treasuries can be swapped for gold. This is a great chart showing the decline of the US$ as part of central bank reserves.
For many years gold bugs and long term followers of gold have harped that one day the physical market will take control and the manipulation from the paper market on Comex will end. Well, this day has arrived and that is why so many main stream analysts don't have a clue what is happening with gold because Comex is not running the market. They don't see the old signals. They are confused because gold should not be rising in price without strong buying on Comex (rising open interest) and inflows into ETFs
The Fed is now in a desperate situation where all they can really do is try to slow down the rise in the gold price as US$ loses more value. The next thing that is likely to surprise markets is a rise in the oil price well over $100. This will not be from supply demand issues or wars but a revaluation in the US$ price of oil. In an inflationary market, oil will often rise with the price of gold, like we saw in the 1970s/80s, 2007/08 and recently in the 2021/22 inflation rise.
A huge mistake by the Biden Administration is now approved in the recent aid package to Ukraine and other allies, and that is to take the ceased Russian assets and give to Ukraine. This is a huge negative for the US$ as other nations see that their US$ assets can be weaponized against them. With gold a tier 1 asset under recent Basal III approval there is a huge run underway out of US treasuries into physical gold. You can see this very obviously with the continued central bank record gold buying.
Gold is as liquid as US treasuries and will become more so as this flight to gold continues and the price rises. With my continued bullish outlook, I want to add another mid tier gold producer to our Selection List, NewGold, but before this one more chart.
There is a slim ray of sunshine on the junior mining market. This chart of the TSX Venture index. It is good to see higher highs but the index is still down -45% since 2021. More encouraging is volume has increased to about 30 million shares per day in the last few months from below 20 million in 2023. We still need to see 60 million plus for a healthy junior market and it will come. I am starting to look at the junior explorers again and will be adding a few new ones to our list.
NewGold - - - - - - TSX&NY:NGD - - - - - - Recent Price C$2.65
52 week trading range $1.17 to $2.75 - - - - Shares Outstanding 690 million
NGD has 2.2 million M&I ounces of gold and 1.147 billion pounds of copper. This works out to about 4.4 million ounces gold equivalent based on $4.50 copper and $2,300 gold. The market is giving a value on this of about US$265/ounce. Not very high for a stable mid size producer with mines in a favourable jurisdiction, especially with the growth potential.
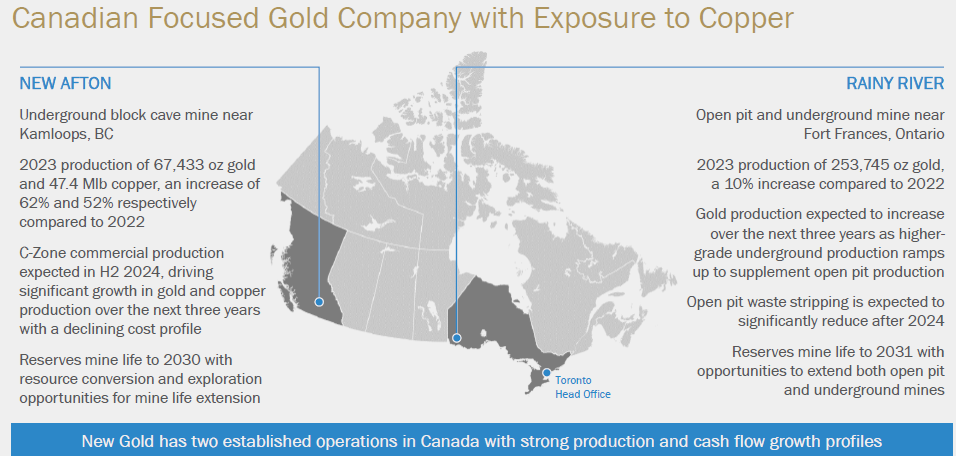
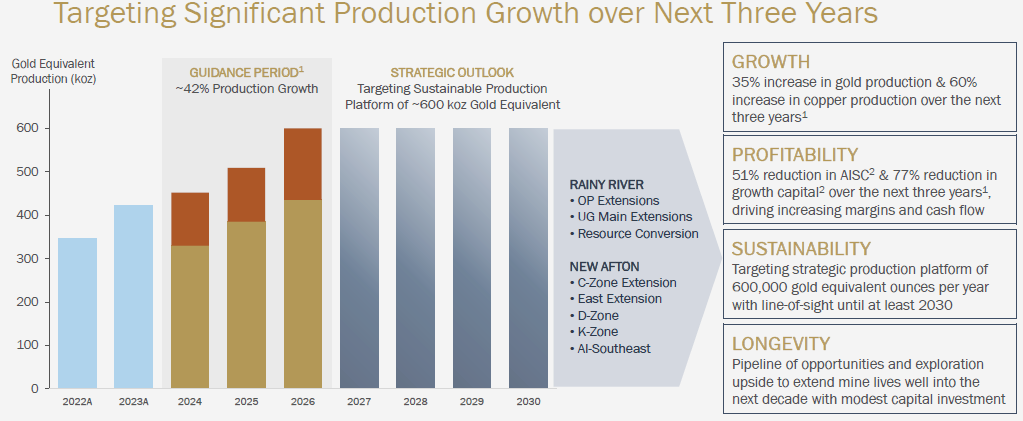
I like NGD now because they are going to see strong production growth starting later in 2024 going into 2025 and 2026. Gold production is going to increase about +35% and copper production about +60% and with this, their costs will drop around -51%. Strong leverage to copper is another thing I like. NGD has two mines, the Afton gold/copper mine in BC and Rainy River in Ontario. Rainy River gave NGD a lot of grief in the first few years of production but that is all worked out now and it has been a stable producer.
At their Afton Mine, commercial production from C-Zone and crusher commissioning remains on track for the second half of the year. At Rainy River, underground Main zone remains on track for first ore in the fourth quarter of 2024. The priority for 2024 is to establish the primary ventilation circuit and access multiple mining zones, facilitating a ramp-up in underground production to approximately 5,500 tonnes per day by 2027.
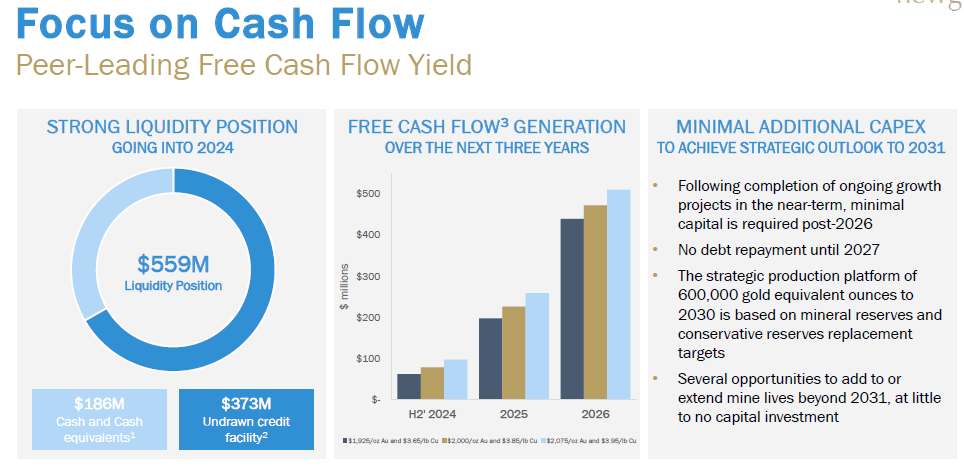
This next graphic from their presentation gives a good picture of their growth profile in the next 3 years.
First quarter 2024 consolidated production of 70,898 ounces of gold and 13.3 million pounds of copper at all-in sustaining costs of $1,396 per gold ounce sold (byproduct basis).
Financial
NGD has $186 million in cash and a 373 million undrawn credit facility so they have plenty of liquidity and operations are generating cash flow
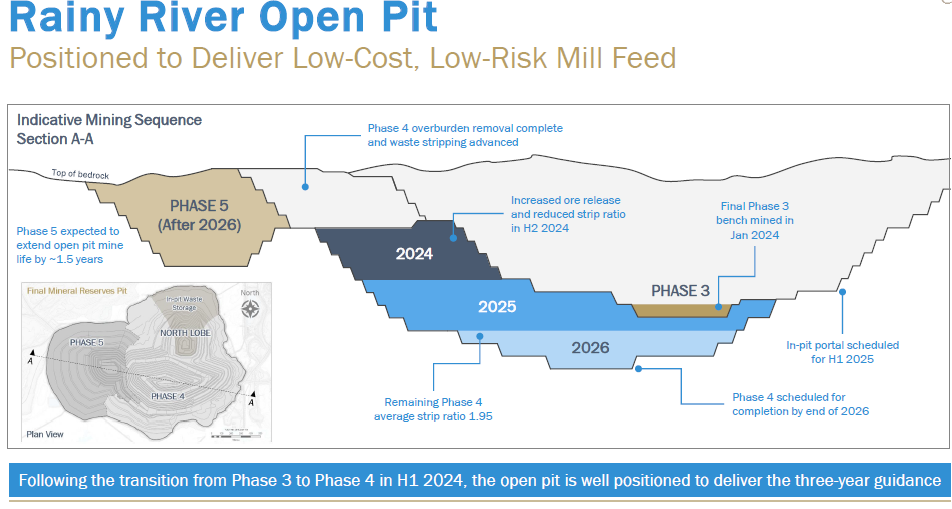
In Q1 2024 revenues was 192.1 million and a net loss of $0.06 per share. Cash flow from operations was $54.7 million. Revenue decreased over the prior-year period primarily due to lower gold sales volumes partially offset by higher metal prices and higher copper sales. Revenues and profits are negatively effected by higher costs now to ramp up future production, especially at Rainy River with high strip ratios. NGD had to remove overburden and waste stripping in the open pit that is now complete. This is to access ore for mining in the 2nd half of 2024.
Conclusion
This graphic is a good picture of how they are advancing the open pit at Rainy River and remember higher grade underground production will also kick in.
The next graphic shows their projected cash flow at different gold and copper prices. The dark blue is at $1,925 gold and $3.65 copper. At the higher end, light blue is at $2,075 gold and $3.95 copper. Currently gold and copper prices are much higher and I am predicting higher still so cash flow could be much higher.
Anyway, we are looking at a 10 times increase in free cash flow. This will dramatically effect the share price to the upside.
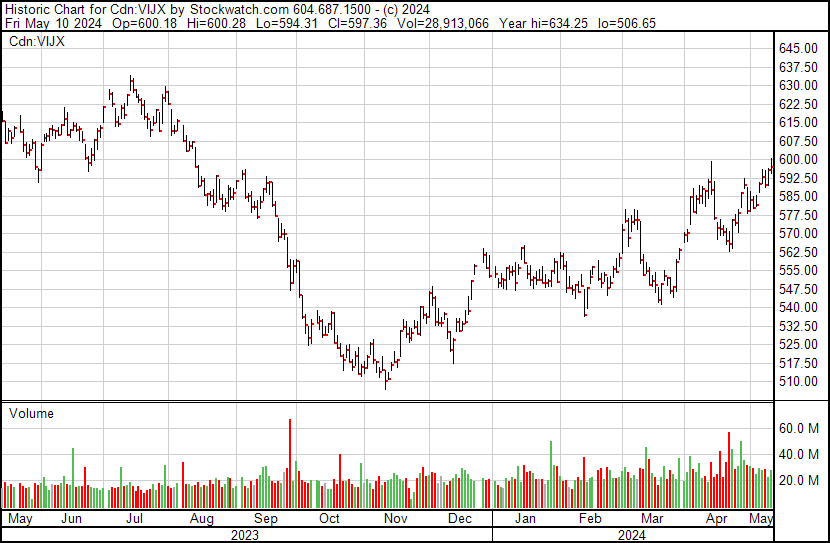
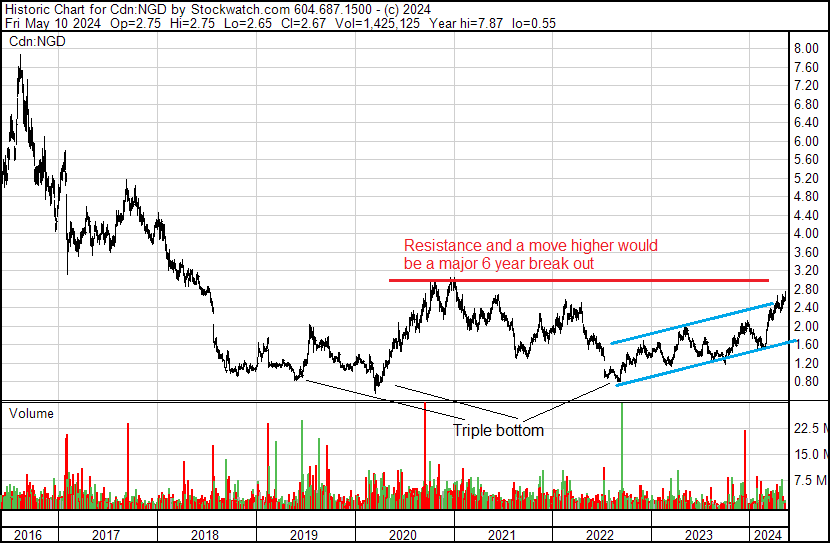
The chart is quite interesting. The weakness in 2017 to 2021 was mostly driven by Rainy River start up and production problems after the mine started production in 2017. There is a nice uptrend on the chart and the stock is close to breaking a major resistance area. That I believe is just a matter of time and will kick off another strong upward move.
Bitcoin
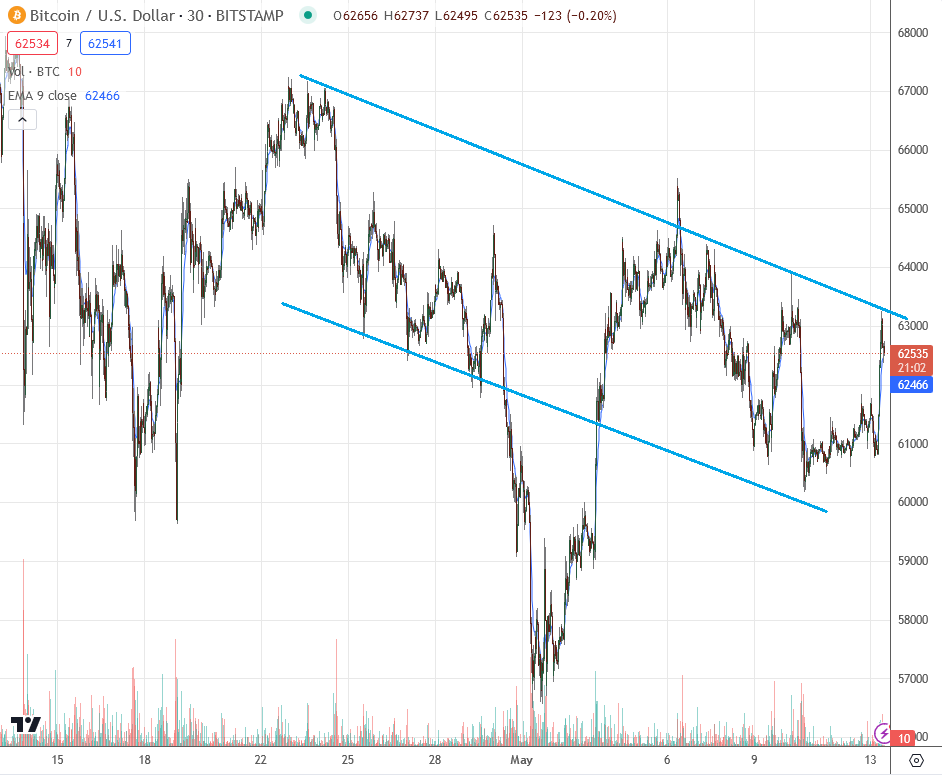
I am thinking of holding our trades a bit longer and over weekends, especially since the last short trade as gone against us. With Bitcoin breaking down on the chart, below $60,000 I believe it will soon go back under that level. The $60,000 area was tested Friday afternoon, but we are seeing a strong rebound this Monday morning. The break down in early May dropped well below the short term down trend. I am expecting a repeat so hold the short SBIT etf we bought at around $54.75. We are down about -10% at this time, but that can change in one day with Bitcoin.
Clip Money - - - - TSXV:CLIP - - - - - Recent Price $0.26
Entry Price - $0.52 - - - - - - Opinion – buy under $0.22
Clip announced that The Michaels Group, a leading Pandora franchise owner, has chosen Clip to modernize deposits and change orders. This partnership has resulted in a 45% reduction in costs, projected to save $2,500 per year for each store.
CLIP had these highlights in their press release:
Revenue for 2023 reached $577,919, a substantial increase from $27,687 in 2022, representing nearly 20x growth year-over-year. Q4 alone saw revenue of $352,582.
Our strategic collaboration with NCR Atleos solidifies our position as the largest multi-bank deposit network for businesses in the United States.
The introduction of new solutions, ClipChange and ClipATM, will drive further growth across various customer segments, including quick service restaurants, retail merchandise, convenience stores, pharmacy and entertainment.
The launch of new solutions ClipChange and CipATM will further accelerate our growth in multiple customer segments, including quick service restaurant, retail merchandise, convenience store and gas station operations, and entertainment.
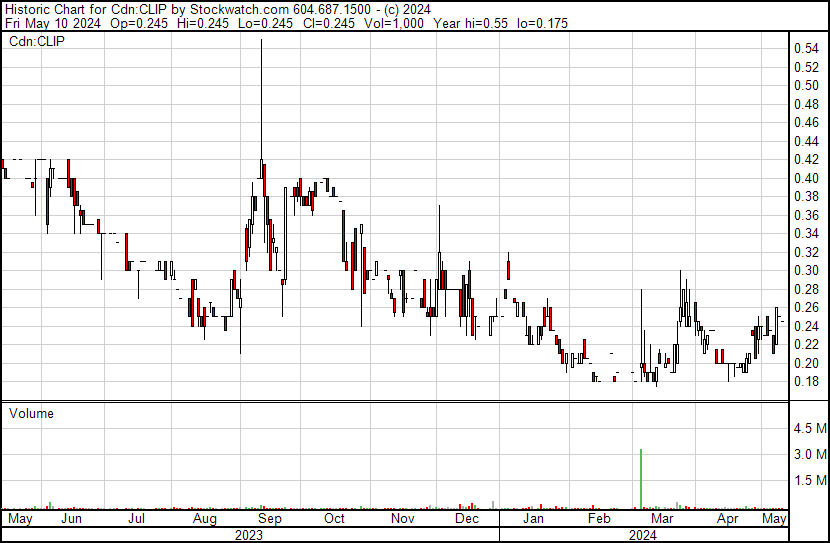
Revenue growth is picking up steam and more money flow into the TSX Venture will also be a benefit to CLIP. And all Canadian juniors. For now we can bottom fish under $0.22
#gold #spy #bitcoin #Newgold
All forecasts and recommendations are based on opinion. Markets change direction with consensus beliefs, which may change at any time and without notice. The author/publisher of this publication has taken every precaution to provide the most accurate information possible. The information & data were obtained from sources believed to be reliable, but because the information & data source are beyond the author's control, no representation or guarantee is made that it is complete or accurate. The reader accepts information on the condition that errors or omissions shall not be made the basis for any claim, demand or cause for action. Because of the ever-changing nature of information & statistics the author/publisher strongly encourages the reader to communicate directly with the company and/or with their personal investment adviser to obtain up to date information. Past results are not necessarily indicative of future results. Any statements non-factual in nature constitute only current opinions, which are subject to change. The author/publisher may or may not have a position in the securities and/or options relating thereto, & may make purchases and/or sales of these securities relating thereto from time to time in the open market or otherwise. Neither the information, nor opinions expressed, shall be construed as a solicitation to buy or sell any stock, futures or options contract mentioned herein. The author/publisher of this letter is not a qualified financial adviser & is not acting as such in this publication.


