Nvidia, Nat Gas Bottom, TCF, GRB, NKTR, WIFI, ZON, Economy
With Nvidia I was thinking that bubble stock had peaked but I was proven wrong. Bubbles are easy to see but hard to predict their top and pin prick. The latest rally resulted in the biggest single-session increase for a U.S. company in history, with Nvidia adding $277B in market value. The increase alone was larger than some of the biggest blue-chip firms, like Coca-Cola. The powerful advance also pushed a record close for the S&P 500 in 2024, and with Nvidia skyrocketing nearly 60% this year, it now accounts for more than a quarter of the benchmark S&P's increase YTD.
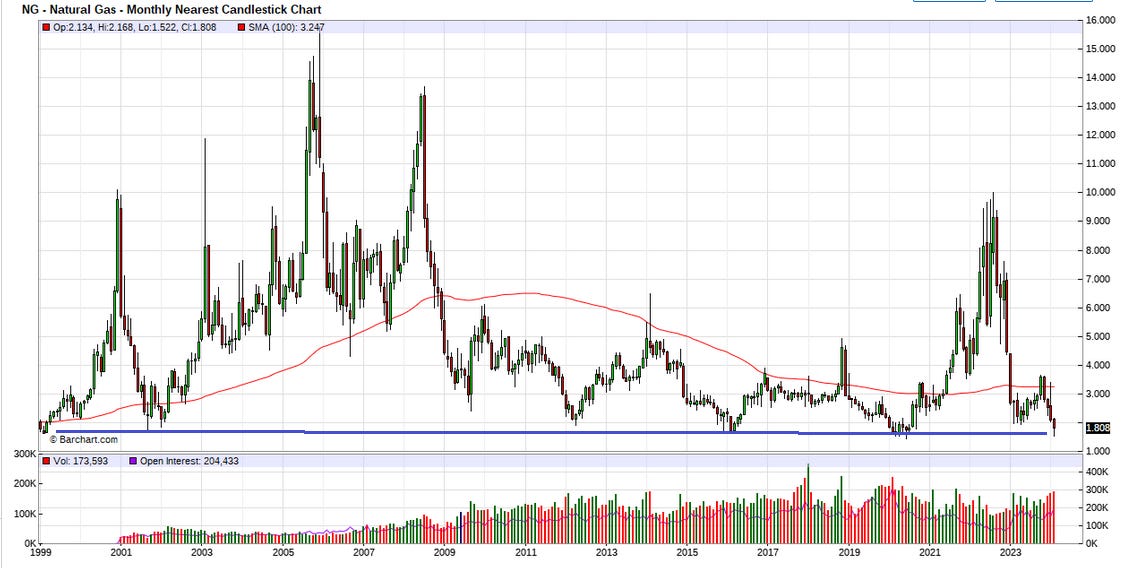
This is a chart of Nat Gas prices going back to the beginning of trading for Henry Hub Natural Gas Futures Contract. Prices declined to the lowest level in real terms since Henry Hub started trading in 1990. Hedge funds have been selling their gas exposure for four weeks, leading to a net short of 1,276 Bcf as of last week. Gas is at all time lows and an absolute bottom. As you can see, gas never stays too long at these low prices because gas producers could not make money at these prices in the past 25 years. They certainly can't now with much higher inflated costs. Prices always rebound from these lows because the producers simply shut down wells and heavily cut supply.
For example prices rebounded by 13% last Wednesday to $1.65 per mmBtu after US gas producer Chesapeake Energy (NASDAQ:CHK) announced it would cut production by 30% this year due to a clearly oversupplied market. More producers will follow suit and I plan to look for some beaten down gas producers to add to our list. Meanwhile my most recent pick saw a bottom and rebound.
Trillion Energy Int. - - - CSE:TCF - - - OTC:TRLEF - - Recent Price - $0.18
Entry Price $0.23 - - - - - - - - Opinion - buy
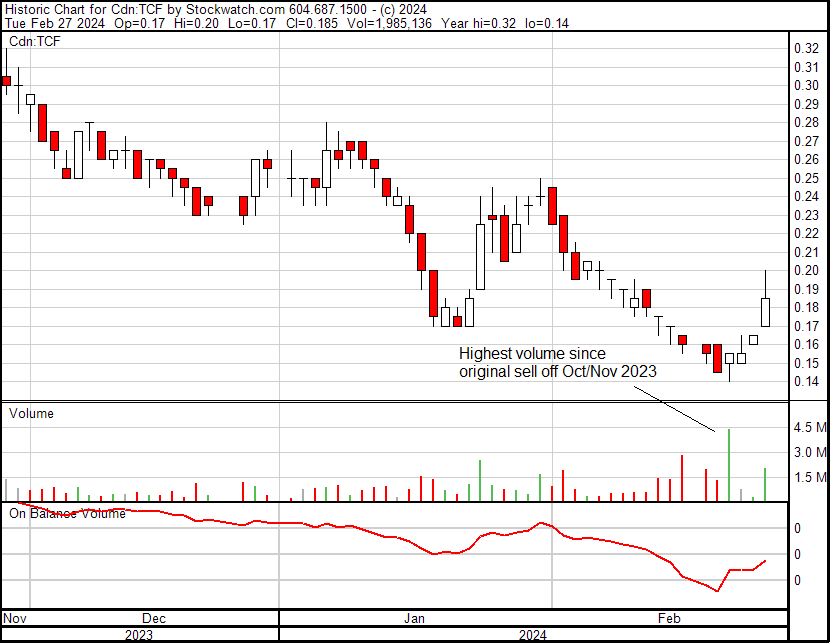
I was speculating that enough stock turned over that all of the sellers were mostly done selling. I believe I miscalculated for not factoring in short volume. The market makers sell stock they don't have and cover so it adds to the total volume and we should factor this in. Short volume has probably been about 1/3 the volume. We will not get the corresponding short report until early March. That said, the recent selloff looks like the final wash out. I used a 3 month chart to show this move better. It was a high volume day with a dip in on balance volume indicating lots of selling.
This also co-insides with the sell off and bottom in Natural Gas. Although TCF has nothing to do with North American gas prices (they sell at European prices), I believe many investors are ignorant or sell off in a panic or in sympathy of the weak market for these energy stocks.
Positive news on Feb. 2, Trillion issued 3.18 million common shares of the company at a deemed price of 20 cents per share in settlement of a bona fide debt of $636,000 owed by the company to Arthur Halleran, its CEO, for $546,000, and two directors of the company for the balance. Often management does this if they expect the stock to rise and the CEO admitted that in the news.
Mr. Halleran, CEO, stated: "When the stock was at five cents a share in 2020, I converted most of my salary into shares, seeing the bright future for the company at that time. Today, I am converting all of my past compensation owed to me into shares, seeing the same value opportunity again. I'm all in on Trillion Energy for the long term."
American Aires - - - - - - CSE:WIFI - - - - - - Recent Price - $0.92
Entry Price - $5.00 - - - - - - - Opinion – sell 1/2
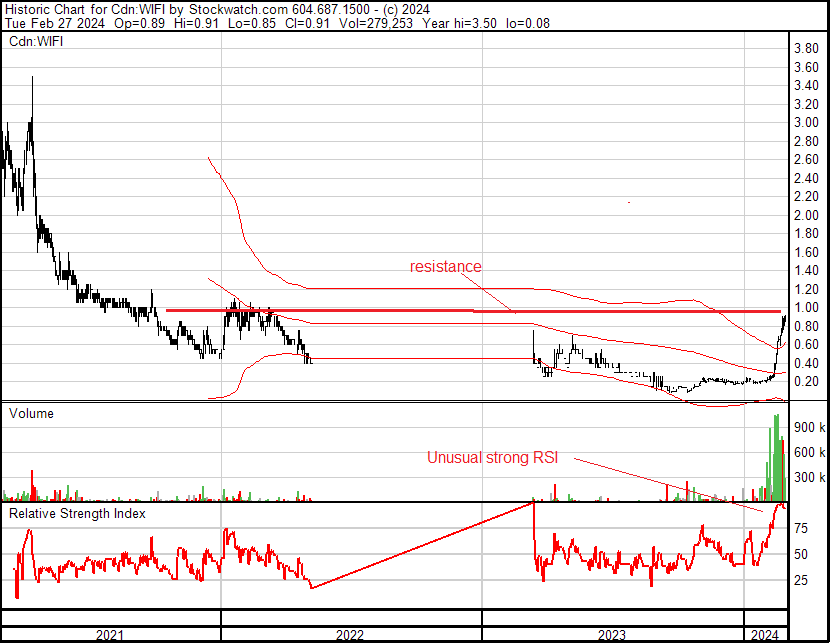
It has been a while since I updated WIFI as it has been languishing and doing nothing since a 10 for 1 roll back, well until just lately. I have mentioned a number of times that I plan on less junior companies on our list, especially Canadian ones. They have to be exceptional. WIFI has seen a very strong rally and we should sell into it. Seldom RSI moves up to 80 and you can see on the chart, that it has gone over 80. Short term the stock is over bought and also near long term resistance. I have always like the companies technology to combat cell phone and such radio frequency output, so I think a good idea to hold half the stock a bit longer and see what develops.
Greenbriar Sustainable - - - - - - TSXV:GRB - - - - - - Recent Price - $1.15
Entry Price - $1.15 - - - - - - - - Opinion – still strong buy to $1.25
I hope many of you bought the stock last week on my update as it saw a strong up day on Tuesday closing at $1.15. That said it still has to breach that $1.25 resistance area.
Nektar Therapeutics - - - - NASDAQ:NKTR - - - - - - - Recent Price $0.75
Entry Price - $0.68 - - - - - - - Opinion – buy
NKTR will release financial s this Monday and I am not expecting any surprise. We will be able to verify most recent cash value and the stock is still well below that. It looks like the stock is trying to break above $0.75. A close above $0.80 would be very positive. Again not much resistance until $1.00
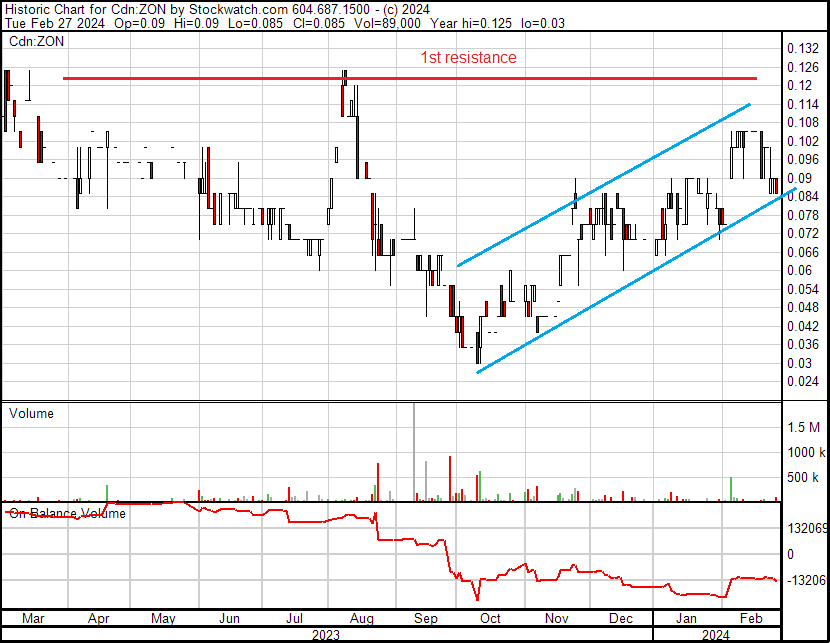
Zonte Metals - - - - - - TSXV:ZON OTC:EREPF - - - - - Recent Price - $0.09
Entry Price - $0.09 - - - - - - - - Opinion – still strong buy to $0.12
I am expecting drill results any time now and I see the stock as a strong buy. There is no drill success speculation built into the stock and with all this strong copper-in-soil data, it is coming from beneath and only a matter of when Zonte discovers it. I think Zonte will get it right this time with K6 drilling.
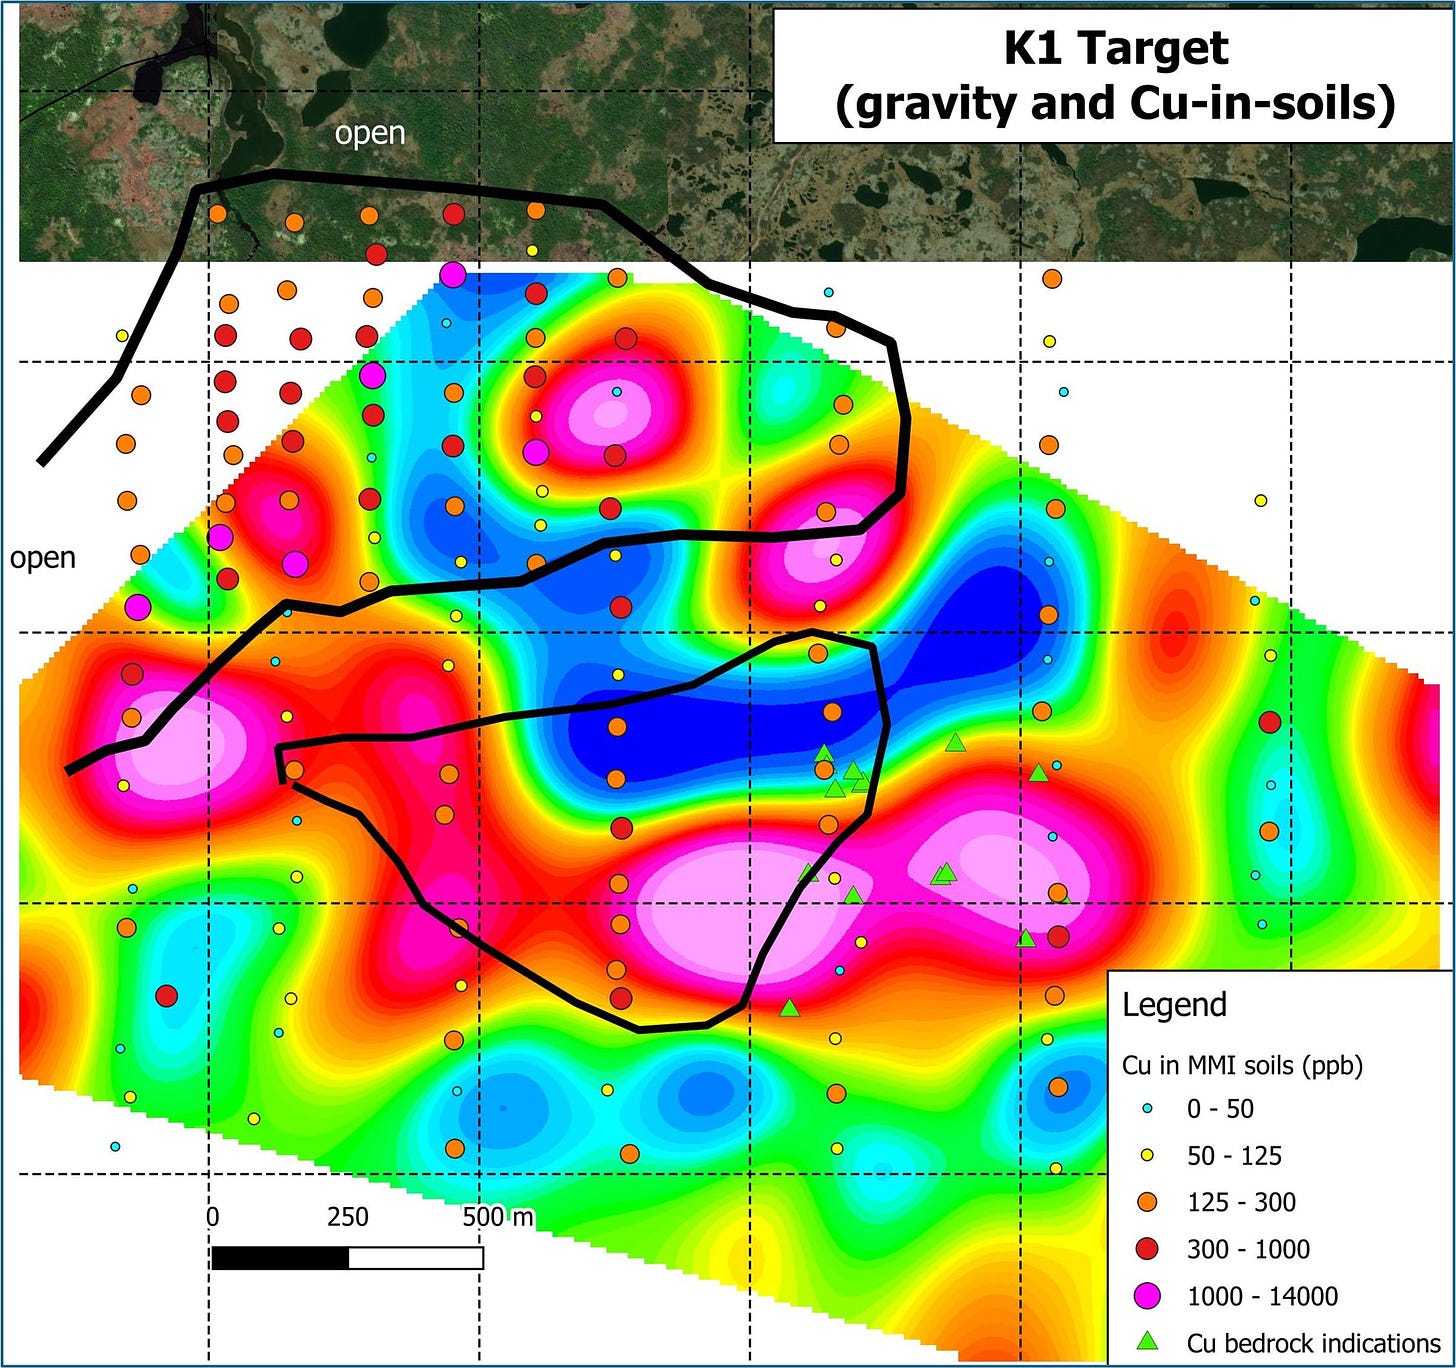
A case in point is Zonte's latest news on the new K1 target. The anomaly was discovered during a gravity survey carried out in the spring of 2023. The anomaly is large and measures two kilometres in length and up to 600 metres in width, and is open along strike in one direction. Soil sampling carried out over the target has identified several large copper-in-soil anomalies spatially associated with the gravity target. Limited prospecting over the target area has also discovered copper mineralization in several locations within the target area.
What caught my eye about this K1 anomaly is the large number of samples that are elevated into the high ranges. This is a very strong soil anomaly. The copper-in-soil anomalies at the K1 target are spatially related to the gravity anomaly as well as with iron oxide, calcic and sodic alteration, copper indications in bedrock and faults. The target will be further advanced with additional soils and a magnetic survey to assess its potential.
The up trend in the stock remains intact (blue lines) and I am expecting at test of $0.12 at minimum, from there will be dependent on drill results and the markets reaction. However, as I pointed out, there is next to no downside from here. On Balance Volume still indicates lots of selling, if this switches to buying or sellers stop, this tightly held stock will really take off.
Pretty much everything in the resource sector remains mired in a bottom and trading sideways at depressed prices. It is very frustrating and a super tough market to make $$. There are a few exceptions and we are catching some of them, like some recent bio techs and WIFI. Others will have their positive turn, but it will require patience to get through this. I believe Greenbriar and Zonte could be the next in line. This weird, strange and crappy market will change, it always does.
One of the worlds most successful investors is not buying into this Magnificent 7 bubble either. Warren Buffett further showed that Berkshire Hathaway's cash pile continued to grow, hitting a record of $167B at the end of 2023.
Meanwhile there are a lot of problems boiling under the surface and being ignored. Retail sales, fell 0.8% in January, the Commerce Department recently reported, breaking a two-month streak of increases. Also December was downwardly revised to a 0.4% increase in December, and the January number was well below economists’ expectations of a 0.1% decline, according to FactSet. The number is much worse when you consider the current 0.3% inflation is adding to the number.
The average reserves at JPMorgan Chase, Bank of America, Wells Fargo, Citigroup, Goldman Sachs, and Morgan Stanley have fallen from $1.60 to 90 cents for every dollar of commercial real estate debt on which a borrower is at least 30 days late, according to filings to the Federal Deposit Insurance Corp. The sharp deterioration took place in the last year after delinquent commercial property debt for the six big banks nearly tripled to $9.3 billion. This problem will come home to roost in 2024.
It is sickening how well Canadian Federal employees are doing in these tough times. The total cost of federal employee salaries and benefits reached a new high of $67 billion in the past year, says Parliamentary Budget Officer Yves Giroux, marking a 68% increase from $40.2 billion in 2016.
Mr. Giroux highlighted the growth in payroll costs in a Feb. 22 report titled “Supplementary Estimates (C),”as first covered by Blacklock’s Reporter. The report said the costs have been expanding at an average rate of 9 percent annually alongside an expansion of the federal workforce, with 428,000 employees in the last year compared to 340,461 in 2016.
Has your wages increase at an annual average rate of 9% since 2016? This Trudeau government is taxing and spending beyond any time in history, even the 1970s inflation period. And he is destroying the country at the same time. His father enacted wage and price controls in the 1970s, Justin needs to implement a federal employee wage freeze and even so they will still be far ahead of us working folk.
Hang in, changes and better days are coming!
All forecasts and recommendations are based on opinion. Markets change direction with consensus beliefs, which may change at any time and without notice. The author/publisher of this publication has taken every precaution to provide the most accurate information possible. The information & data were obtained from sources believed to be reliable, but because the information & data source are beyond the author's control, no representation or guarantee is made that it is complete or accurate. The reader accepts information on the condition that errors or omissions shall not be made the basis for any claim, demand or cause for action. Because of the ever-changing nature of information & statistics the author/publisher strongly encourages the reader to communicate directly with the company and/or with their personal investment adviser to obtain up to date information. Past results are not necessarily indicative of future results. Any statements non-factual in nature constitute only current opinions, which are subject to change. The author/publisher may or may not have a position in the securities and/or options relating thereto, & may make purchases and/or sales of these securities relating thereto from time to time in the open market or otherwise. Neither the information, nor opinions expressed, shall be construed as a solicitation to buy or sell any stock, futures or options contract mentioned herein. The author/publisher of this letter is not a qualified financial adviser & is not acting as such in this publication.


