


Short Bitcoin Again, Gold Heading Up, Market Crash!

We ended up with very good timing yesterday to exit our short Bitcoin trade with a +5.5% gain. Often peaks and valleys in trading occur outside the ETF trading hours, but yesterday we got our chance around 12:30PM. I suggested selling SBIT at $11.95 or better and it went as high as $12.04 so I will list sold at $11.95. I still believe the next major move is down because Crypto is part of the current speculative bubble. I sent the sell alert out on 'signal' to paid readers. We are shorting again today, and Bitcoin is presently at the level we are putting the trade on.

My plan was to short bitcoin again when it got back up to around $100k. I just so happened as I was going to send out this issue. So I am suggesting to buy the SBIT short ETF around $10.40.
Gold Bull will Keep Roaring
I find it quite intriguing how gold stocks are still not performing that great and the junior market has still not come to life. I believe this is because most investors don't understand what is driving this market and don't believe gold can go higher. The other factor is bubbles in the stock market and Crypto are diverting $$. When stock markets weaken, investors will buy more gold/gold stocks.

Since I called the bottom and next gold rally in October 2022, both gold and the HUI gold bugs index are up about +60%. Normally in bull markets, the gold stocks out perform gold, that is yet to come.

Gold stocks in the HUI saw quite a correction but the up trend is still intact. Next target is 375, which is the 2020 high when gold went up to $2,000.
As long term readers know, I have been pointing out a typical pattern of year end weakness in gold. In the last 10 years it often happened in December, but the last 2 years have been in October/November. Once again this year will be the October bottom. We are not entering a seasonal strong period for gold and I expect we will soon see new record highs. It is Central Back buying of physical metal that keeps driving this bull market higher and that shows no sign of ending. BRICs countries have been steady buyers and now many European countries have joined with the Ukraine uncertainty and especially now with the tow big economies Germany and France in political turmoil and recessions. China also reported gold buying in November, although they never stop buying just did not bother reporting. Maybe it's $3,000 plus gold that wakes up North American investors?
Junior Explorers still Languishing
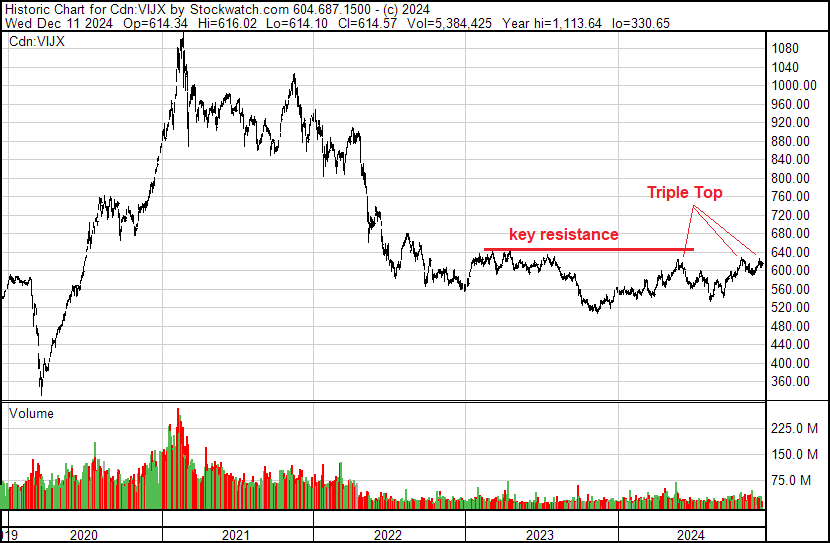
As you can see on this chart of the TSX Venture Index, juniors have been basically going sideways along a bottom for two years. As I have been commenting, we need to see a break to 660 and volume increase. At this point we have a triple top and I expect that to hold with December tax loss selling and then see 660 in January with the typical New Year rally. I am betting and with my own $$, that 2025 is the year, the juniors wake up.
Stock Market Crash and Bubble
I have been commenting this year, especially the later half that the market is topping out. I thought that was maybe going to be July, but here we are still higher. The Trump rally that I expected was much stronger than I expected but might easily end up the blow off top. I have some interesting charts that show how over valued and out of sync this market is.
Retail investors have piled into this bubble market like no other time in history, outdoing the 2000 dotcom bubble and the 2007 real estate bubble. This is a big red danger flag.

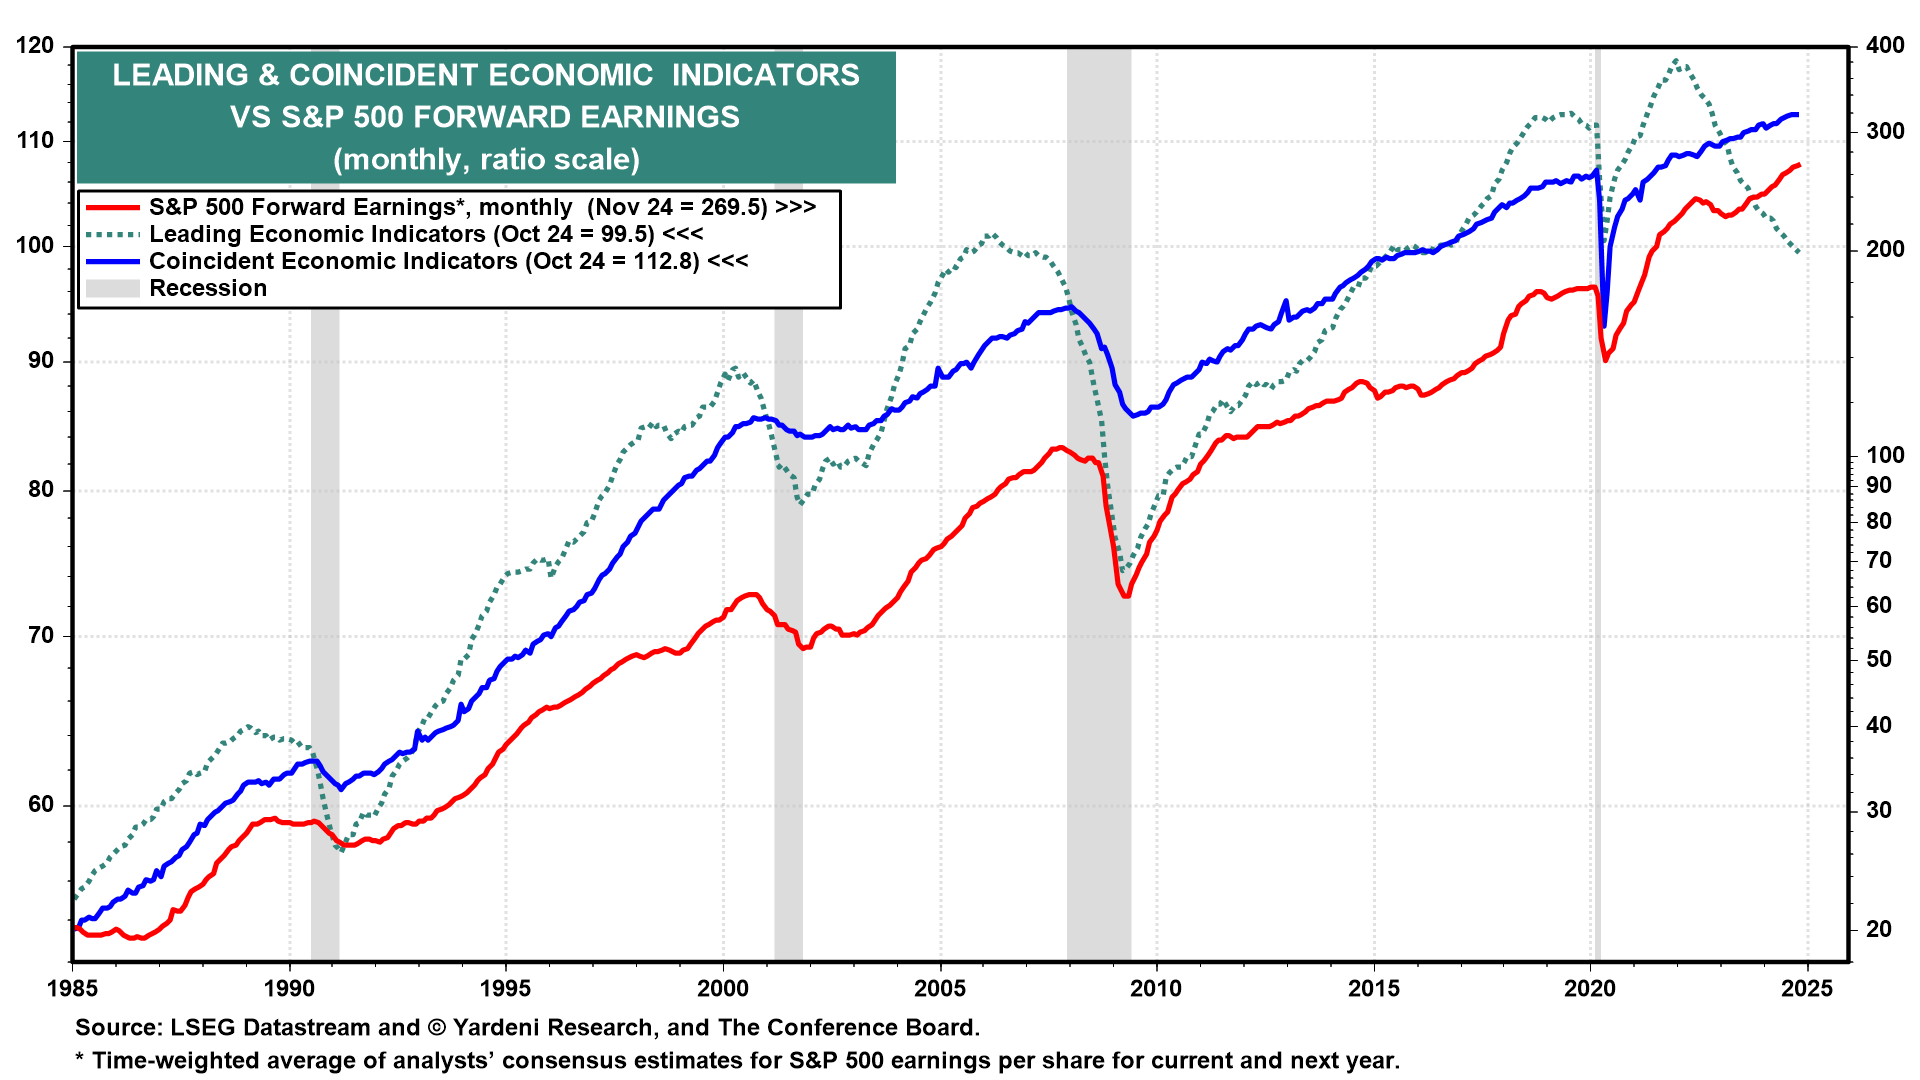
In the last 40 years when the Leading Economic Indicator (LEI) had a significant decline the market soon followed into a bear market. The reason is that as the economy declines, so do company earnings and multiples. However this time around the market has not yet responded to the plunging LEI. I believe this might be because of some pre election manipulation and the market's belief that the Fed will engineer a soft landing. That said, the Fed has a very poor track record of achieving this and this go around they are dealing with massive government debt and sticky inflation putting mine fields in their path.
U.S. consumer prices increased by the most in seven months in November. The consumer price index rose 0.3% last month, the largest gain since April after advancing 0.2% for four straight months, the Bureau of Labor Statistics reported today. In the 12 months through November, the CPI climbed 2.7% after increasing 2.6% in October.
The Fed is still a long way off from bringing the inflation rate down to their 2% core inflation target. In the 12 months through November, the so-called core CPI gained 3.3%. That followed a similar advance in October. If energy prices were to move higher we would see a big jump back up.
Crude oil inventories in the US plunged 5.1 million barrels, more than expected, surprising analysts even as imports surged in the week ended November 29, the US Energy Information Administration (EIA) report showed. News just out this morning with another drop of 1.4 million for the week ended December 6. Oil inventories are at multi year lows and 6% below the 5 year average for this time of year.
If Trump goes ahead with his 25% tariffs on Mexico and Canada it would surely put upward pressure on oil and energy prices. Another bullish factor is a more normal or cold winter. With inventories so low, there is little room for any problems.
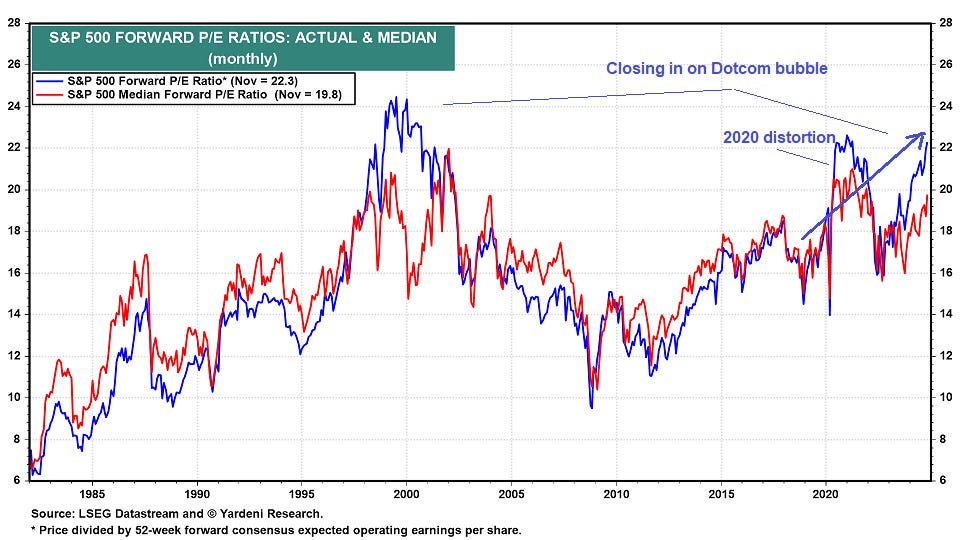
This next chart is forward P/E ratios and you can see the market is getting very pricey. The quick 2020 crash and quick recovery caused a distortion in the numbers and if we smooth this out we can see a steady and recently strong increase since the 2008 bottom. We are now approaching levels last witnessed in the dotcom bubble.
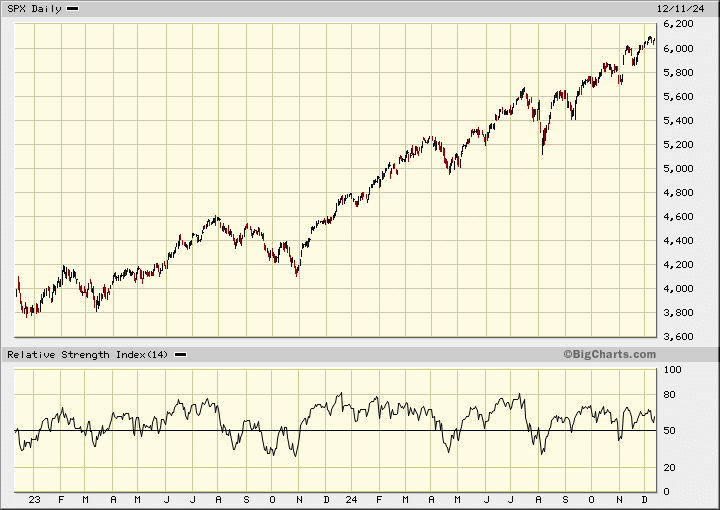
I will end with the S&P 500 chart. I expect we will have the typical Santa Claus rally, but this may lead to a blow off top set for a January correction. The market has not had a decent correction since July.
All forecasts and recommendations are based on opinion. Markets change direction with consensus beliefs, which may change at any time and without notice. The author/publisher of this publication has taken every precaution to provide the most accurate information possible. The information & data were obtained from sources believed to be reliable, but because the information & data source are beyond the author's control, no representation or guarantee is made that it is complete or accurate. The reader accepts information on the condition that errors or omissions shall not be made the basis for any claim, demand or cause for action. Because of the ever-changing nature of information & statistics the author/publisher strongly encourages the reader to communicate directly with the company and/or with their personal investment adviser to obtain up to date information. Past results are not necessarily indicative of future results. Any statements non-factual in nature constitute only current opinions, which are subject to change. The author/publisher may or may not have a position in the securities and/or options relating thereto, & may make purchases and/or sales of these securities relating thereto from time to time in the open market or otherwise. Neither the information, nor opinions expressed, shall be construed as a solicitation to buy or sell any stock, futures or options contract mentioned herein. The author/publisher of this letter is not a qualified financial adviser & is not acting as such in this publication.