


Tariffs and Inflation, Canada Economy Sucks
Aztec AZT, AYA Silver

The Consumer Price Index in April rose 2.3% on an annual basis, rising less than economists had expected at 2.4%, according to economists polled by financial data firm FactSet. Yet CPI is still reflecting price hikes that remain above the Federal Reserve's goal of bringing down inflation to a 2% rate. On a month-over-month basis, the CPI rose 0.2%, lighter than the 0.3% pace forecast by economists.
There has been lots of narrative that Trump's tariffs will cause more inflation and he is acting like an irrational idiot. His tariff plan is yielding nothing. Here is a typical thing you would see, in the NY Times today about the recent China announcement.
“But China made no concessions. By now, most of us are familiar with this pattern: Trump makes big claims about what his tariffs can get, only for him to later back down without the other country giving up anything meaningful. It happened with Mexico, Canada and most of Trump’s “Liberation Day” levies. “
First off, Trump is a showman, he wants to show, look what I can do with these high tariffs. I think he is taking a wrong approach and it has not been thought out well. It became obvious that carpet bombing trading partners and allies is a poor approach so some bombers are called back and tariffs are reduced. The NY Times did have an excellent graphic on the U.S./China tariffs.
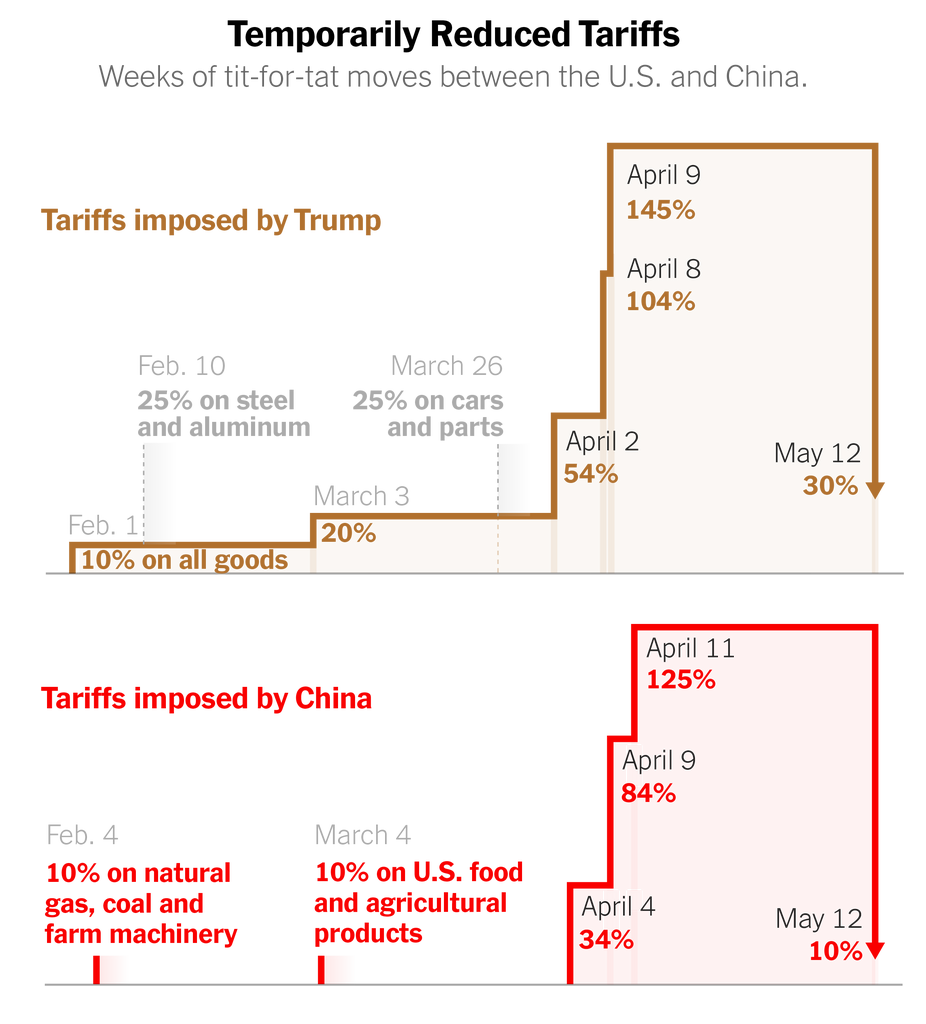
The Times, saying China made no concessions is very misleading, because the U.S. and China are under trade negotiations so we have no idea if any concessions will be made. Trump has not backed down on Canada yet, unless you say no tariffs on goods under the free trade agreement is some kind of reprieve. There is still 25% on Canadian steel, aluminum and 10% on oil along with tariffs on autos and some parts.
And commenting same with most of Trump's Liberation Day levies when thus far only bombers to the U.K. and China were called back. This really just qualifies as Trump bashing, not facts. Trump’s deals with China and the UK have one thing in common, they’re not binding and they leave a huge amount of negotiation down the line. We really don't know what they mean at this juncture.
The NY Times own graphic still shows tariffs on China at 30% which is still expensive. As I have said countless times, we will have to wait and see what comes out of all this before drawing any conclusions. Trump seems to be making some headway with trade deals but not as much as he brags about. Meanwhile a 30% tariff on the biggest importer, China will bring in some revenue.
I doubt tariffs will cause much more inflation either because the consumer is already tapped out to bare higher prices. Most tariff charges will get absorbed before they hit the consumer. If too high there was simply no trade. At 30% there is still trade but their probably not passed to the consumer. First there is the exporter than the importer than into distribution before finally on the consumer. I would bet that most of the tariff cost will be absorbed by the exporter and importer.
Canada Jobs Disaster Blamed on Trump's Tariffs
For some predictable reason, Canada's poor jobs report in April is being blamed on tariffs. I looked at the U.S. other major trading partners and the U.K. that just made a tariff deal and there is no mention of tariff issues. There is not reliable data out of China so here are three examples
The U.K. economy and job market has been declining since 2023 and although April was another poor month, there was nothing mentioned about tariffs. Latest survey data collected from U.K. recruitment consultancies indicated a further reduction in permanent staff appointments during April amid reports of weak employer confidence and tighter hiring budgets. That said, the latest reduction was the softest seen since last September. A similar trend was observed for temp billings, which fell at the slowest pace in four months. Also both permanent placements and temp billings fell at softer rates compared to March.
Data from the Mexican Social Security Institute (IMSS) show that 34,179 new formal jobs were created in March 2025. No April data yet. With this figure, the first quarter of the year represents a cumulative job creation of 226,731, a figure 38,228 lower than the same period in 2024. so a slow down like most countries.
In Japan after decades of weak growth, their economy is among the best in the world at present. Japan’s 2025 recruitment market faces talent shortages due to an aging population, driving demand for skilled professionals in tech and healthcare.
So why is Canada so bad? It is not a tariff problem but simply a continuation of a failing economy under the previous Liberal government policies. Nothing changed in April, other than they have a new excuse to lay blame to.
“Trump’s tariffs are going to erode the manufacturing sector over time in Canada. We’re just at the start of it, in my view,” Jack Mintz, President’s Fellow at the University of Calgary’s School of Public Policy, told The Epoch Times.
Statistics Canada’s April Labour Force Survey shows that the biggest job losses were in the manufacturing sector followed by wholesale and retail trade.
According to the published data, there were 30,600 job losses in manufacturing (down 1.6 percent from March) and 26,800 in wholesale and retail trade (down 0.9 percent), while employment increased the most in public administration (up 3 percent) with a gain of 37,100 government jobs, followed by the finance, insurance, real estate, and rental and leasing sector with a gain of 23,700 jobs (up 1.6 percent).
Richard Dias, an analyst for IceCap Asset Management, says the decline in manufacturing jobs is “directly related” to American tariffs on Canada.
The jobs report was way better than March. As April had 7,400 jobs added vs -33,000 job losses in March. April numbers were effected positively by additional government workers for the election.
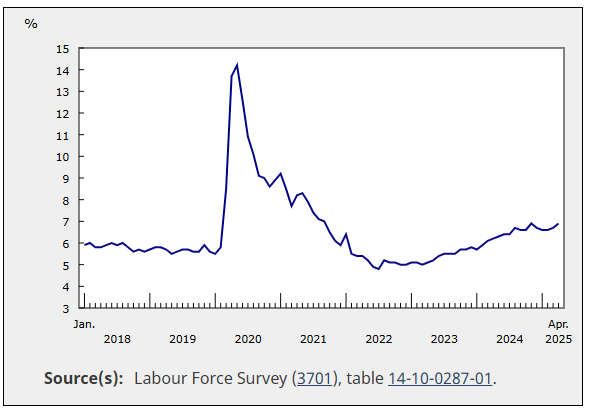
My main point is that you cannot just look at one month. The fact is, that Canada's unemployment rate has been increasing since the beginning of 2023, long before Trump and his tariffs.
Stats Canada, Unemployment Rises in April
Aztec Minerals - - - TSXV:AZT - - - - Recent Price - $0.18
Entry Price -$0.40 - - - - - Opinion – buy, average down to $0.25
Aztec has closed an oversubscribed non-brokered private placement, consisting of 20 million units at a price of 18 cents per unit for aggregate gross proceeds of $3.6-million.
Simon Dyakowski, Aztec Minerals president and chief executive officer, stated: "We are pleased to complete this oversubscribed non-brokered private placement financing and are grateful for the ongoing support of our existing shareholders and several new shareholders. Notably, Aztec welcomes Crescat Capital as a strategic institutional shareholder."
The big deal about Crescat is they have world renowned geologist Quinton Hennigh PhD and Crescat and Quinton often promote the stocks they invest in. I will also say that they don't invest in juniors unless there is high certainty of a mine being developed.
With the financing done, new strategic investors and down near the bottom of it's trading range on the chart, now is the time to buy and average down if you paid higher prices.

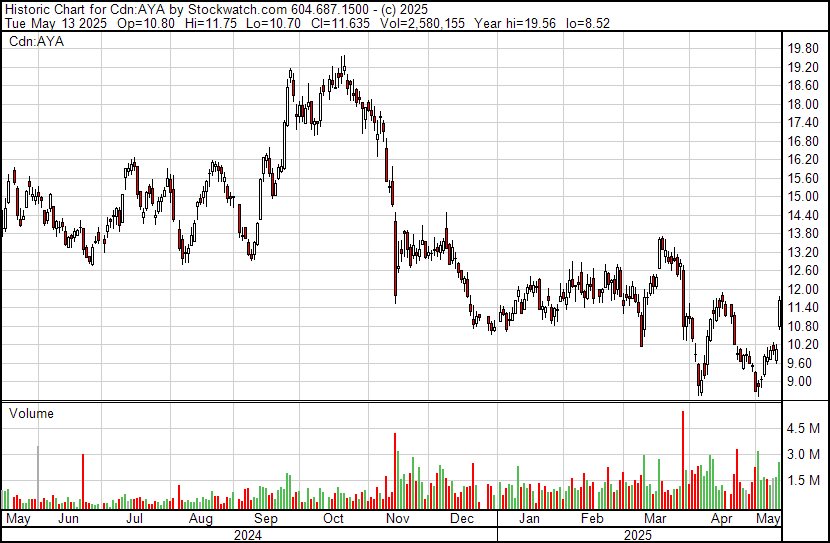
Aya Gold & Silver - - - TSX: AYA; OTC: AYASF - - - Recent Price - $11.60
Entry Price - $11.43 - - - - - - - Opinion - buy
Today Aya announced first quarter financial and operational results for the three-month period ended March 31, 2025 and the stock popped higher. All amounts are in US dollars, unless otherwise stated.
Q1-2025 Highlights:
Silver production of 1,068,652 ounces ("oz") in Q1-2025 compared to 366,362 oz in Q1-2024, a 192% increase.
Ore processed increased to 249,743 tonnes ("t"), reaching record throughput levels, compared with 81,331t in Q1-2024, a 207% increase.
Mine production increased to 194,661t, achieving an average mining rate of 2,163 tonnes per day ("tpd"), compared with 106,880t in Q1-2024, an 82% increase.
Record revenues of $33.8 million ("M"), up 566% year-over-year, with an average net realized silver price of $31.87/oz.
Operating cash flow of $7.9M, compared to a negative cash flow of $3.7M in Q1-2024.
Cash cost per silver ounce sold decreased to $18.93/oz in Q1-2025 from $20.31/oz in Q1-2024.
Net income of $6.9M, compared to a net loss of $2.6M in Q1-2024; diluted EPS of $0.05.
Robust financial position with $37M in cash and restricted cash, compared to $49M as at December 31, 2024.
Accounts receivable of $11.6M as at March 31, 2025 compared to $1.8M as at December 31, 2024. Funds received in early Q2-2025 from sales that occurred in the last days of Q1-2025.

Paid Advertisers at playstocks
All forecasts and recommendations are based on opinion. Markets change direction with consensus beliefs, which may change at any time and without notice. The author/publisher of this publication has taken every precaution to provide the most accurate information possible. The information & data were obtained from sources believed to be reliable, but because the information & data source are beyond the author's control, no representation or guarantee is made that it is complete or accurate. The reader accepts information on the condition that errors or omissions shall not be made the basis for any claim, demand or cause for action. Because of the ever-changing nature of information & statistics the author/publisher strongly encourages the reader to communicate directly with the company and/or with their personal investment adviser to obtain up to date information. Past results are not necessarily indicative of future results. Any statements non-factual in nature constitute only current opinions, which are subject to change. The author/publisher may or may not have a position in the securities and/or options relating thereto, & may make purchases and/or sales of these securities relating thereto from time to time in the open market or otherwise. Neither the information, nor opinions expressed, shall be construed as a solicitation to buy or sell any stock, futures or options contract mentioned herein. The author/publisher of this letter is not a qualified financial adviser & is not acting as such in this publication.