Debt Problem, Oil Month end Sell Off Again, Silver Pops, BFG video
Welcome and thank you to all the new, smart, savvy and contrarian investors to my substack. If you like outside the box thinking, a humble analyst that has spent his career studying market and economic cycles, picked numerous tops and bottoms, someone not afraid of controversial topics and can be a bull and a bear, your at the right place. Please share and subscribe.
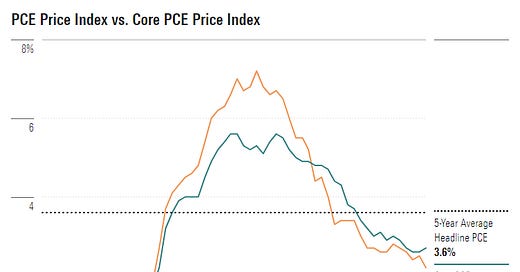
The August Personal Consumption Expenditures Price Index posted a softer-than-expected increase, up 2.2% from year-ago levels. Economists forecast that the PCE index would rise 2.7%. When volatile food and energy costs are factored out, the Federal Reserve’s preferred measure of inflation increased 2.7% from one year ago, in line with expectations.
The PCE Price Index increased 0.1% from month-ago levels. Excluding food and energy, the PCE Price Index also increased 0.1%. This is good news for the Goldilocks narrative, but as I have been commenting, energy prices will go back up and ruin the party.
Consumer spending, which accounts for more than two-thirds of U.S. economic activity, rose 0.2% last month after an unrevised 0.5% gain in July, reported the Commerce Department's Bureau of Economic Analysis. Economists polled by Reuters had forecast consumer spending climbing 0.3%. The consumer is getting more and more tapped out with high debt levels.
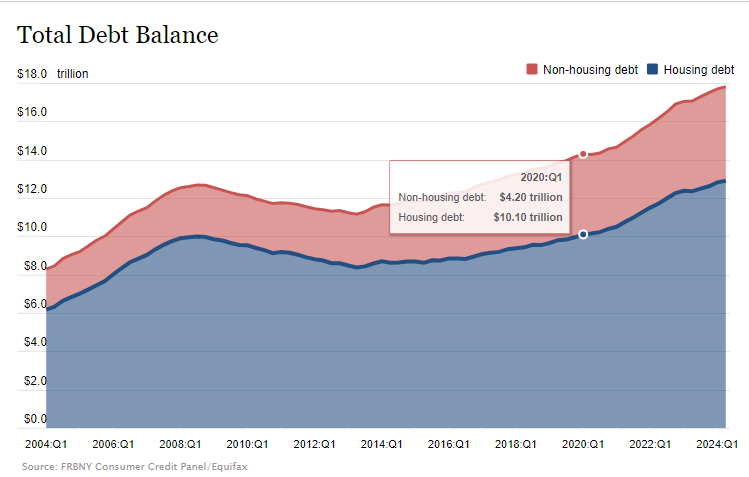
Consumer debt came down since 2008 and started to rise around 2018, but really exploded upwards since 2020.
NY Fed reports that Mortgage balances shown on consumer credit reports increased by $77 billion during the second quarter of 2024 and stood at $12.52 trillion at the end of June. Balances on home equity lines of credit (HELOC) increased by $4 billion, the ninth consecutive quarterly increase after 2022Q1, and there is now $380 billion in aggregate outstanding balances, $63 billion above the series low reached in the third quarter of 2021. Credit card balances, which are now at $1.14 trillion outstanding, increased by $27 billion during the second quarter and are 5.8% above the level a year ago. Auto loan balances saw a $10 billion increase, and now stand at $1.63 trillion. Other balances, which include retail cards and other consumer loans, were effectively flat, with a $1 billion increase. Student loan balances declined by $10 billion, and now stand at $1.59 trillion. In total, non-housing balances grew by $3 billion
Housing debt increased 27% and non housing 17%. An economy built on too much debt is not a healthy one. Credit cards had an average balance of $6,501 per cardholder in Q3 2023. Also add on what some call phantom debt. It is estimated that it could hit $687 billion by 2028. The popularity of “buy now, pay later” (BNPL) products has exploded in recent years, and consumers are using this short-term financing option, often offered on online shopping sites, to buy everything from makeup to groceries to electronics.
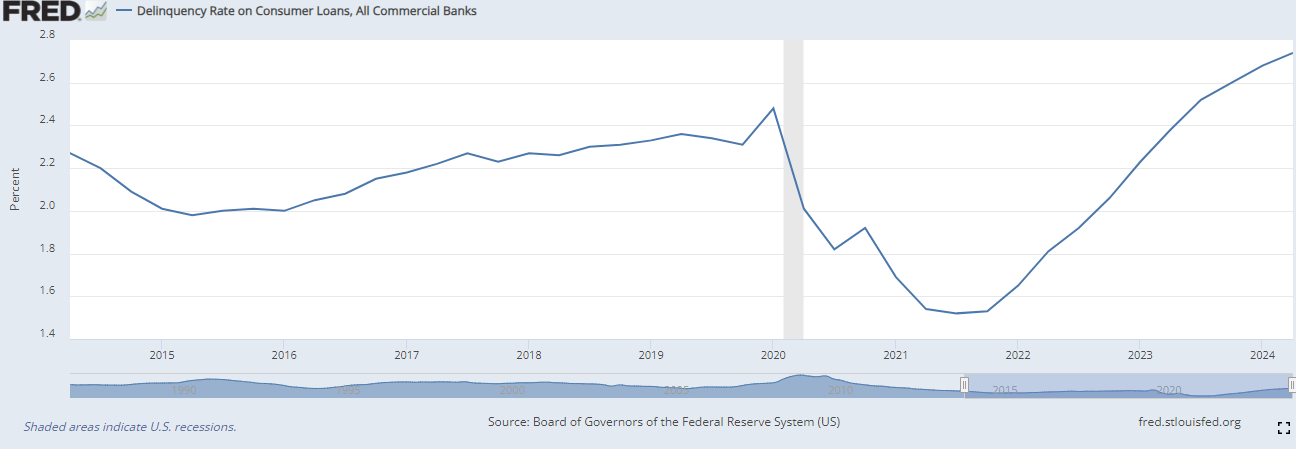
In one sign of stress, aggregate delinquency rates increased in Q1 2024, with 3.2% of outstanding debt in some stage of delinquency at the end of March. Delinquency transition rates increased for all debt types. Annualized, approximately 8.9% of credit card balances and 7.9% of auto loans transitioned into delinquency. As of Q2 2024, over the last year, approximately 9.1% of credit card balances and 8.0% of auto loan balances transitioned into delinquency. Delinquency rates are well above the last peak, end of 2019.
Oil Does it’s Month End Slump Again
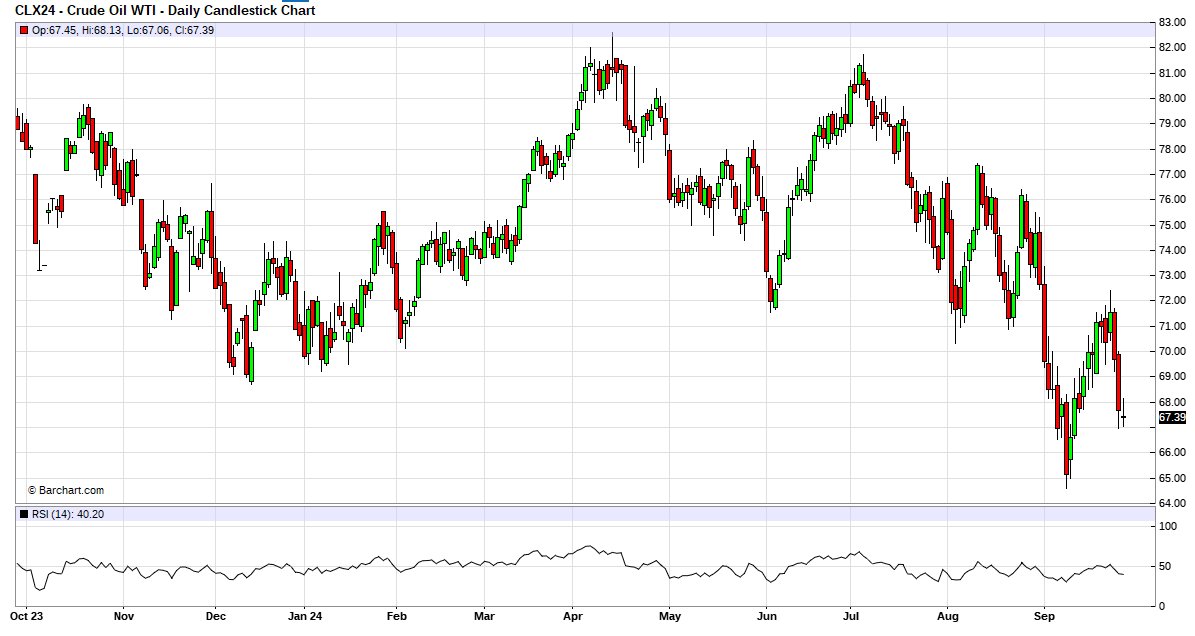
Earlier this week, I commented that oil prices had bottomed, but was concerned of another month end sell off. Like clockwork, it arrived. A consistent trading pattern in any asset is not normal. I am convinced this is intervention ahead of the election. Therefore this is probably the last month oil will be taken down. I am surprised nobody else is talking about this strange pattern.
It is the same rinse and repeat cycle, when prices rise it is because of fears on low supply and when prices fall it is fear of too much supply. The big story of this week has come from Saudi Arabia, with media outlets alleging Riyadh is considering a strategy revamp of retaking market share in the oil markets. Fearing oversupply, market participants witnessed a $3 per barrel drop from a week ago. Who knows if this is true or just spun narrative???
At the peak of Hurricane Helene, some 30% of US offshore oil output was offline as 27 producing platforms were evacuated, equivalent to an outright impact of 510,000 b/d, but shut-ins had dropped by Friday as oil companies resumed operations.
Crude oil stocks keep falling and an important issue nobody is talking about is Canada's new pipeline, the Trans Mountain Expansion. It has a nameplate capacity of 590,000 b/d of which roughly two-thirds are currently utilized, limited the inflows of Canadian oil to Cushing and hindered any reasonable stock build over the summer.
Cushing’s current stockpiles of 22.7 million barrels as of September 13 represent less than a third of the storage hub’s operational capacity of 78 million barrels, stoking concerns that tank bottoms could prompt a sudden supply squeeze to refiners. As of September 20, they increased slightly by 116,000 barrels to 22.8 million barrels, a first build in seven weeks.
More Hurricanes Coming
We are about half way through the hurricane season and already two hurricanes have shut production. Heaven forbid there is a direct hit in the oil producing Gulf region because there is no room for error now.
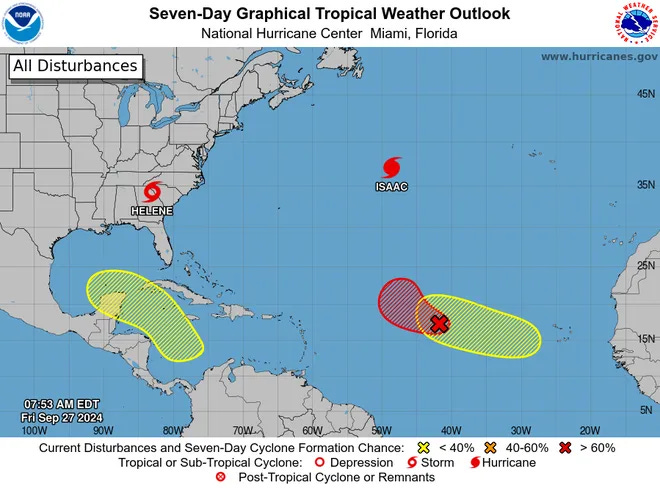
Helene just wreaked havoc on Florida. Now Isaac has strengthened into a hurricane, and another system could develop in the Gulf of Mexico by the end of next week. The National Hurricane Center is tracking Isaac and three other systems: one in the Caribbean Sea and two in the Atlantic, one of which became Tropical Storm Joyce early Friday.
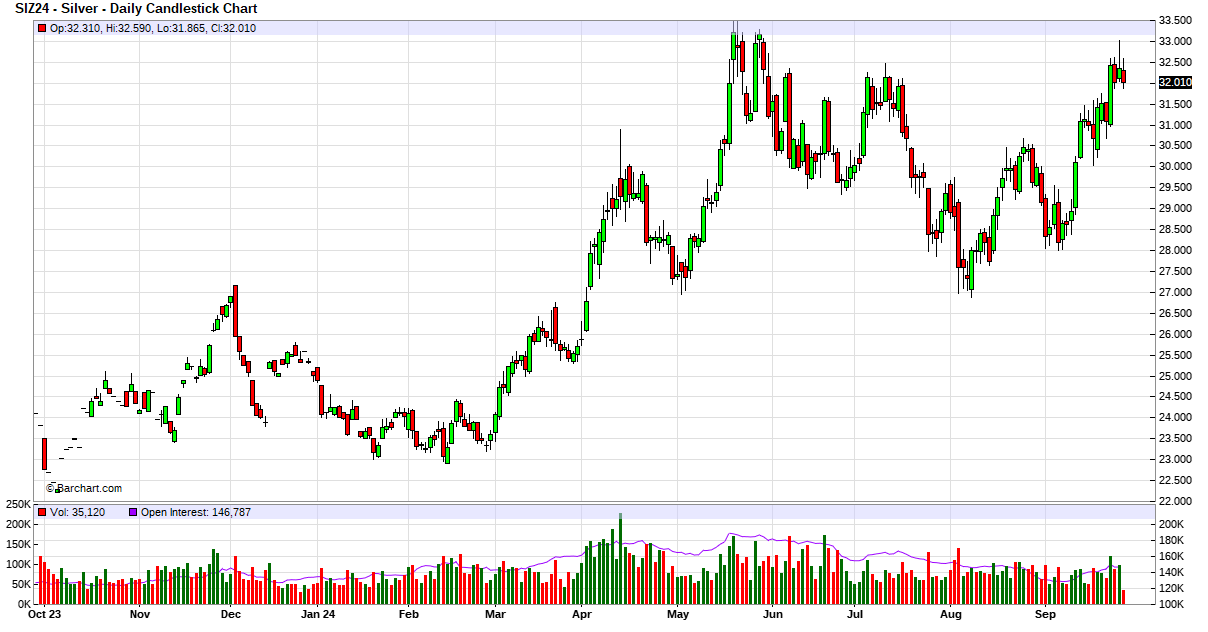
Other metals are picking up steam withe US$ weakness. Copper futures for December delivery surged past the $10,000 per metric tonne threshold as China unveiled wide-ranging stimulus measures to breathe life into its ailing real estate market, settling above $10,200/mt and sending mining stocks up by 6-7% this week. Silver spot prices made new highs and was in some news, but Comex prices need to breach $33.50 to get me more excited.
Silver's performance has about caught up with gold, but both metals are seeing little love in North America. Comex silver open interest (chart below) is down in the dumps, way below levels earlier this year and farther still below 2020 levels. I checked my coin dealer and they have all kinds of 1 ounce silver rounds available. As I commented, so far North American investors are sitting out this precious metals rally and even shorting gold stocks with the 'DUST' etf. That's OK, we will need their buying at higher prices.
It might take a correction in the stock markets to get investors diversifying. I will be watching closely because a surge in North American demand might mark a short term top. Gold $3,000 and $50 silver are on the way, as the stealth rally will continue.
Giant Mining - - - CSE:BFG - - - Recent Price $0.28
Opinion – buy
Giant Mining put out a very good video by their geologist a couple days ago. It does a good job explaining what the drill results mean and the potential of the project. About 20 minutes and worth the watch.
(119) Giant Mining's Majuba Hill: 1.35% Copper Over 66.4m from Surface | Buster Hunsaker - YouTube
Paid Advertisers at playstocks
All forecasts and recommendations are based on opinion. Markets change direction with consensus beliefs, which may change at any time and without notice. The author/publisher of this publication has taken every precaution to provide the most accurate information possible. The information & data were obtained from sources believed to be reliable, but because the information & data source are beyond the author's control, no representation or guarantee is made that it is complete or accurate. The reader accepts information on the condition that errors or omissions shall not be made the basis for any claim, demand or cause for action. Because of the ever-changing nature of information & statistics the author/publisher strongly encourages the reader to communicate directly with the company and/or with their personal investment adviser to obtain up to date information. Past results are not necessarily indicative of future results. Any statements non-factual in nature constitute only current opinions, which are subject to change. The author/publisher may or may not have a position in the securities and/or options relating thereto, & may make purchases and/or sales of these securities relating thereto from time to time in the open market or otherwise. Neither the information, nor opinions expressed, shall be construed as a solicitation to buy or sell any stock, futures or options contract mentioned herein. The author/publisher of this letter is not a qualified financial adviser & is not acting as such in this publication.

